The 10/24/26 blog “U.S. Stock Sector Analysis – October 2026” examined the three U.S. stock sectors that made new all-time highs during the week of 10/19/26 to 10/23/23. Today’s blog – 10/25/26 looks at the technology sector.
The daily Technology Sector ETF (XLK) chart and the Semiconductor index (SOX) chart courtesy of Trading View illustrate their relationship.
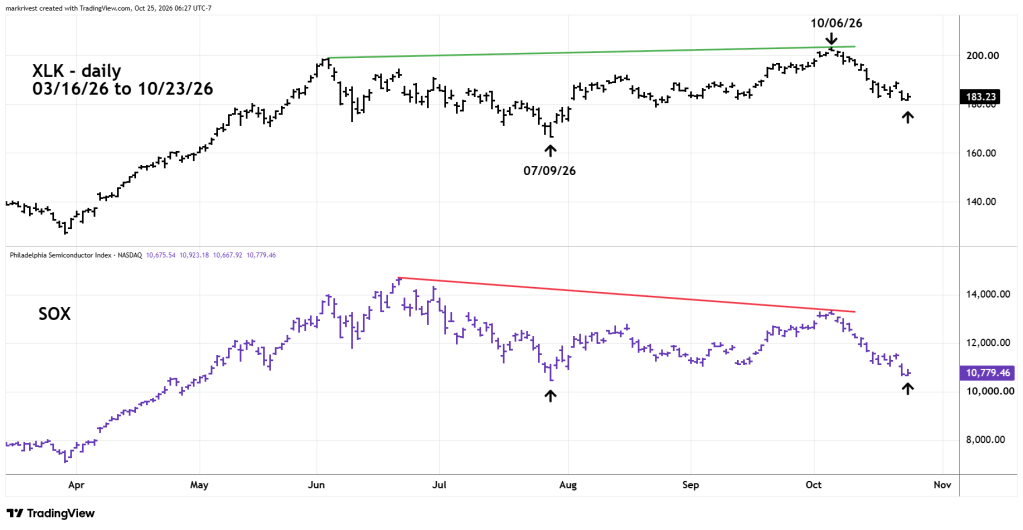
Many of the stocks that compose XLK are also in SOX, their performance should be very similar. From late March to early June, they moved together. In mid – June SOX briefly outperformed on the upside. After mid – June SOX has been bearish relative to XLK.
The SOX decline into July was deeper than XLK’s drop. On 10/06/26 XLK reached a new all-time high, while SOX had only retraced 68% of its June to July drop. As of 10/06/26 – SOX had retraced most of the 07/09/26 to 10/06/26 rally.
From late March to early June both XLK and SOX were the driving force of the broader U.S. stock bull market. Now they look like they are in an emerging bear market.
One of the reasons why XLK is relatively more bullish than SOX could come from the performance of one stock – Apple Inc. (AAPL) which is in XLK not SOX.
The daily AAPL chart illustrates its action since June 2026.
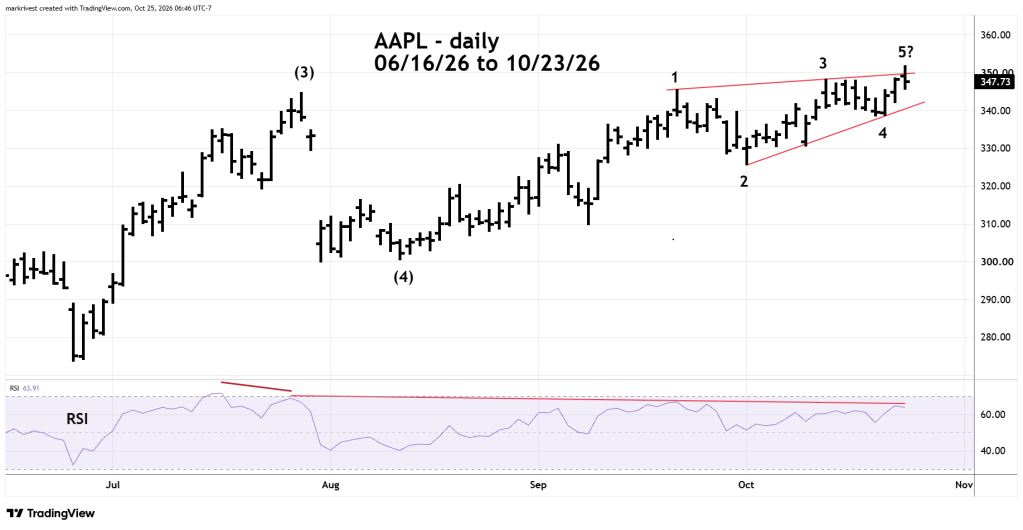
It’s possible on 10/23/26 – AAPL completed an Elliott wave – Ending Diagonal Triangle. These are termination pattens that imply dramatic reversal ahead. In this case AAPL could decline within two to three weeks to the 300 area. The RSI double bearish divergence since the July price peak supports this theory.
A sharp APPL decline could put bearish pressure on XLK.
An acceleration of XLK’s downside performance could put bearish pressure on the broader U.S. stock market.

