When only one of the three main U.S. stock indices; S&P 500 (SPX), Nasdaq Composite (IXIC), and Dow Jones Industrial Average (DJI) makes a new all-time high it’s a bearish signal. On 08/13/26 only SPX reached a new all-time high. This signal was invalidated on 10/06/26 when both the Nasdaq Composite (IXIC) and S&P 500 (SPX) made new – all-time highs.
Regardless of this signal the overall condition of the broader U.S. stock market is very bearish.
The 10/04/26 blog “Nasdaq Internal Momentum – October 2026” illustrated the Nasdaq Composite – Advance Decline line (A/D). A follower of this website correctly commented that the Nasdaq Composite has a weak A/D line because of the large number speculative stocks in the Nasdaq Composite.
There are relatively fewer speculative companies in the S&P 500. The daily SPX – A/D line ($SPXADP) chart courtesy of StockCharts.com shows its performance since October 2025.
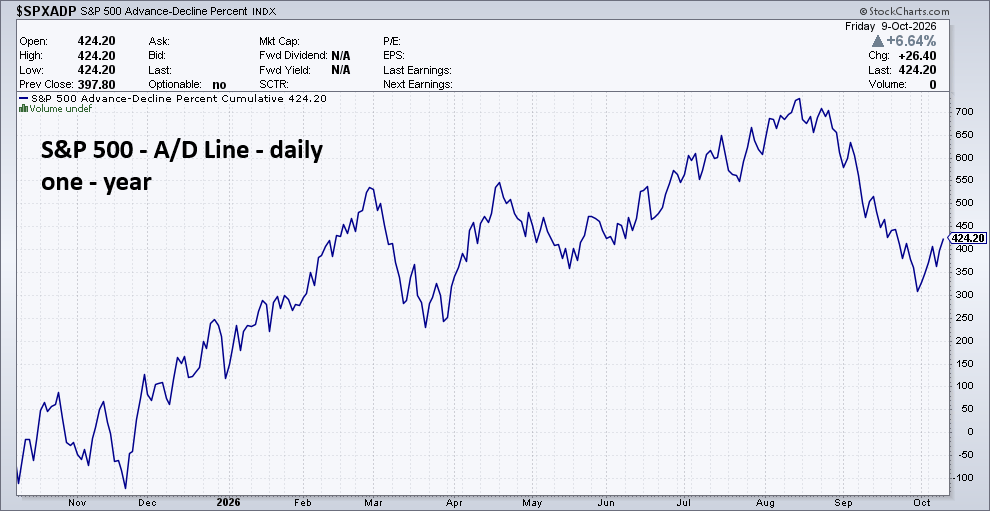
Even though the SPX – A/D line has held above its March 2026 bottom, the decline from August to September is larger than the February to March drop. Since August 2026 many SPX stocks have been in bear trends.
The next daily chart courtesy of Trading View compares the SPX to the percentage of SPX stocks above the 200 – day moving average (S5TH).
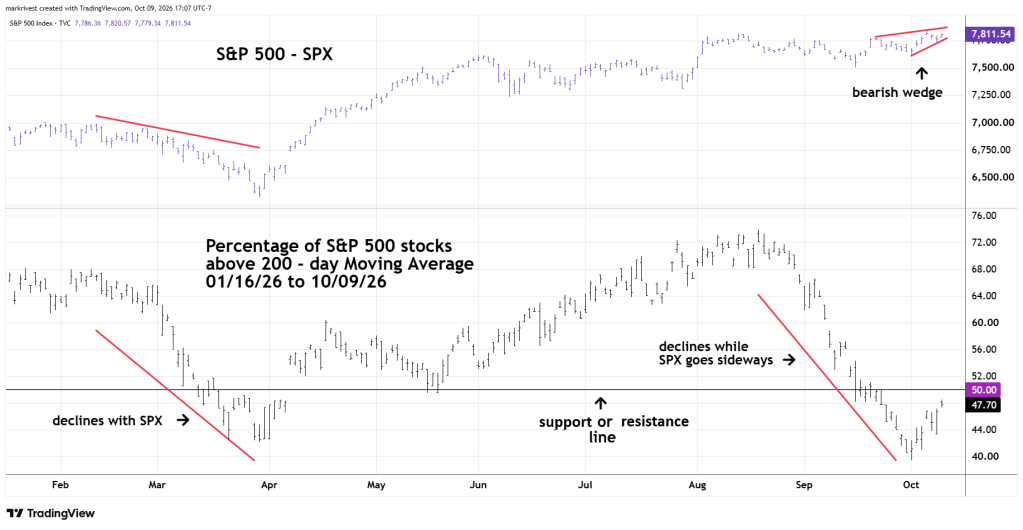
Unlike March 2026, SPX since August 2026 has been in a sideways trend channel. A few SPX companies are masking a bear market.
Sometimes the 50.00 level can act as support or resistance. In this case the rally from 10/01/26 could terminate at or near 50.00.
Also, please note the SPX bearish wedge forming since 09/22/26. An important signal, bullish or bearish could soon develop from this formation.
This wedge and other factors will be examined in the next blog.

