On 10/02/26 Nasdaq Composite and its sub index Nasdaq 100 – made new all – time highs. How are these bullish leaders performing underneath the surface of price action? The answer is shocking.
Two of the main internal stock market momentum indicators are Advance/Decline lines (A/D) and New 52 – week Highs and Lows.
The Nasdaq Composite – daily cumulative A/D line ($NAAD) courtesy of StockCharts.com illustrates its action over the prior two years.
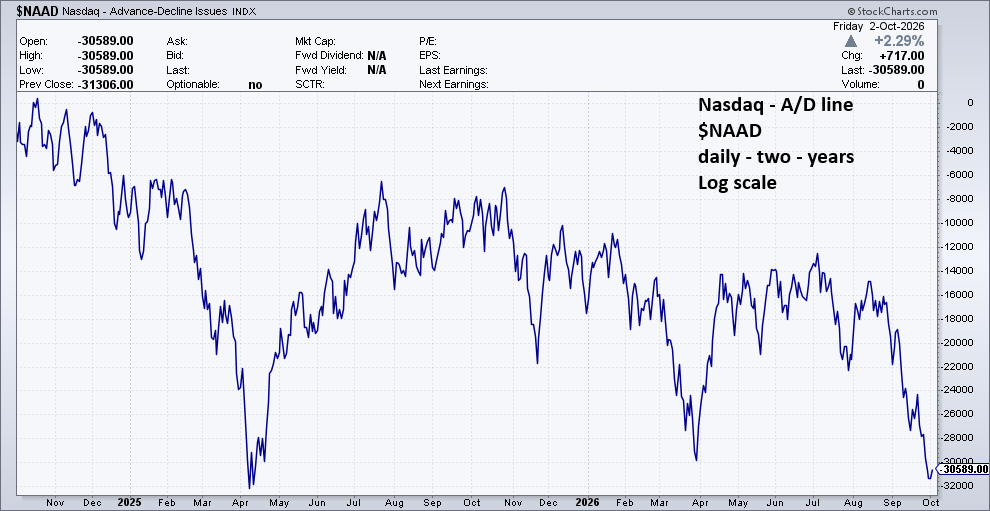
Nasdaq A/D line has gone below its March 2026 low and is close to going below its April 2025 bottom! Even more shocking, both the S&P 500 – A/D line and NYSE – A/D line have so far only retraced about 80% of their respective post March 2026 rallies. This implies the Nasdaq rally is being led by a very small number of stocks.
The Nasdaq Composite daily – 52 – week new highs chart courtesy of Barchart.com tells us precisely the number of stocks leading the rally.
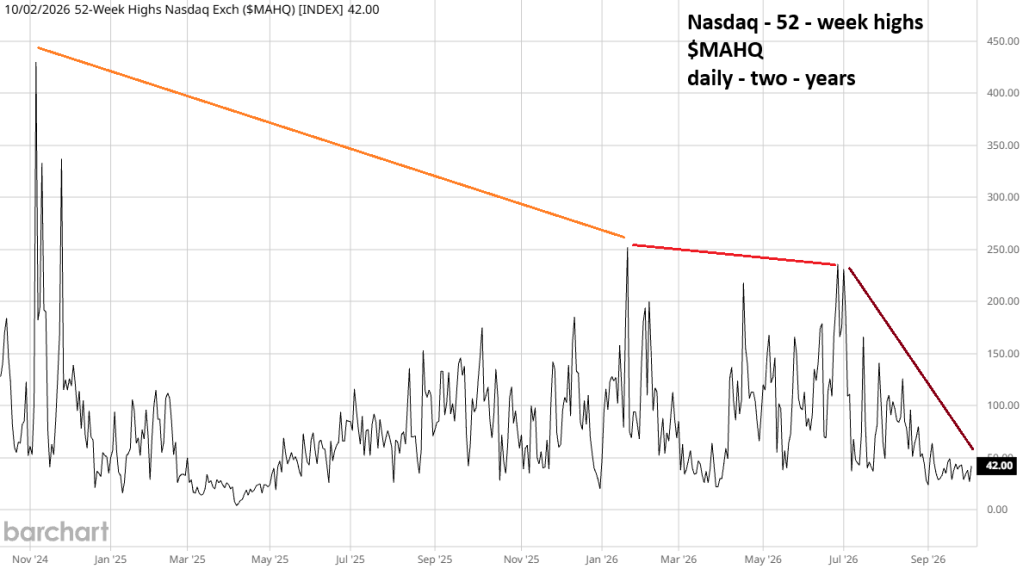
There are approximately 3,300 stocks composing the Nasdaq Composite. On 10/02/26 only 42 stocks made 52 – week highs! Diversification is supposed to be the key to stock investing. If you have a diversified stock portfolio you are probably underperforming the broader U.S. stock market by a wide margin.
The next chart from StockCharts.com shows the Nasdaq 100 – Bullish Percent Index ($BPNDX).
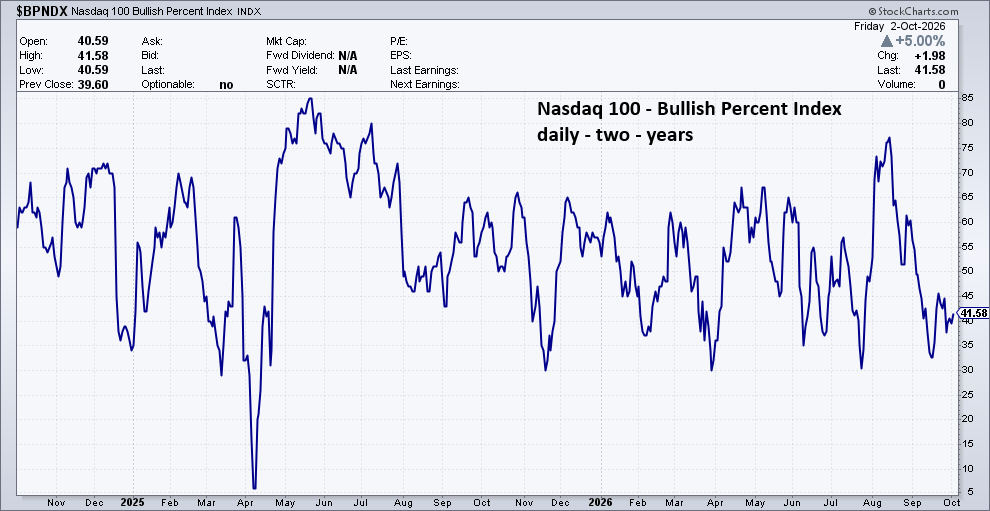
The Bullish Percent Index (BPI) is a breadth indicator based on the number of stocks on Point & Figure Buy Signals within an index. It helps you understand the internal health of an index by looking at the number of components that are on a bullish or bearish track.
BPI is not a precise timing tool. For stock market peaks bearish divergences could span over one year or more. For stock market bottoms strong moves up from a bottom are a broad indication of a bull market. Please note the $BPNDX action after the April 2025 bottom. $BPNDX peaked in May 2025 yet Nasdaq 100 – continued to rally for several months.
A bullish case could be for the current $BPNDX action. Note the move up in mid -September 2026. The S&P 500 Bullish Percent Index ($BPSPX) did not have a move up in mid – September.
We always need to analyze the weight of the evidence. There’s very bearish evidence from A/D lines and 52 – week highs. Marginally bullish evidence from the Nasdaq 100 – Bullish Percent Index.
There’s a good chance for a broad-based U.S. stock market decline.


The Nasdaq Composite always has weak breadth. It is a reflection of the stocks that comprise the index. Unlike other indices, a large number of Nasdaq stocks are speculative companies that are eventually delisted from the index. It’s well known that over long periods of time, the Nasdaq Composite index will show a declining cumulative A/D line. That’s why there is much more interest in the financial community in following the NYSE A/D line rather than the Nasdaq Composite for identifying trend changes.
LikeLike
Hi David
Thanks for this information. My main point of this blog was to examine the Nasdaq and had to illustrate the Nasdaq A/D condition. Your correct about the more speculative nature of Nasdaq. This factor does not negate the weakening internal situation. There are also non speculative companies that are failing to make new highs.
NYSE A/D line which has been illustrated in recent blogs is also bearish.
LikeLike