On the surface the three main U.S. stock indices; S&P 500 (SPX), Nasdaq Composite, and Dow Jones Industrial Average are close to their all-time highs. By measurement of price these indices are in bull markets. If you look underneath the surface most U.S. stocks are in a bear market.
The daily SPX chart courtesy of Trading View illustrates its action.
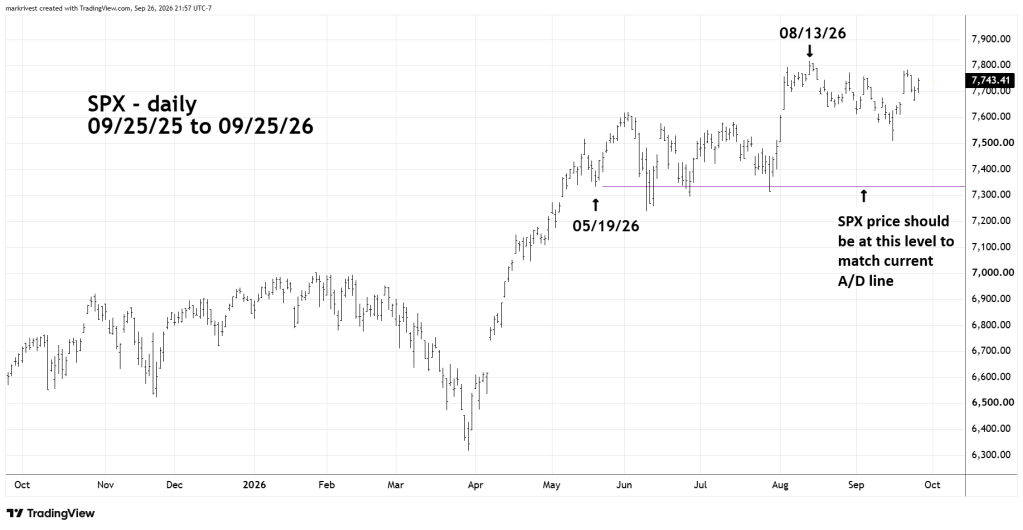
SPX reached its all-time high on 08/13/26, as of 09/25/26 it was only 1% below this high and could make a new all-time high in one – trading day. If price action matched the current level of the S&P 500 – A/D line, it would be trading near the level made on 05/19/26.
The daily S&P 500 – A/D line chart ($SPXADP) courtesy of StockCharts.com shows its movements since September 2025.
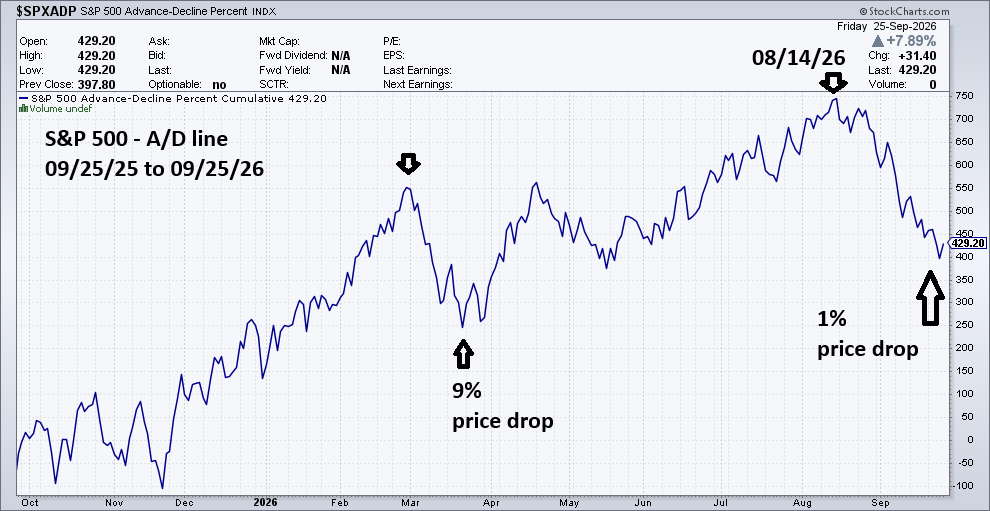
Please note the March 2026 – A/D decline resulted in about a 9% -SPX drop. Now examine the A/D decline since 08/14/26. The drop is larger than the March decline, yet SPX is as of 09/25/26 down only 1%!
Either SPX or the A/D line are giving a false signal.
If it’s SPX there could soon be a decline of at least 8%, possibly much more.


Focusing on SPX ignores the real story. Nasdaq Composite is the leading the way to a recovery. As you pointed out in your 9/20 blog, the tech sector is the strongest right now. But it is not just leading the way in terms of price action, it is also leading the way in terms of breadth. This bullish development provides the best clue to the direction of equity markets.
LikeLike
Hi David
Thanks for the comment. Your correct about the Nasdaq bullish breadth. Major stock market turns never have 100% evidence supporting a bullish or bearish case. The weight of evidence from all four stock market dimensions is currently are very brearish.
The evidence illustrated in the most recent blog is just the tip of the momentum evidence. There are several U.S. stock sectors that are significantly off their all-time highs.
Enidence from the sentiment dimension has been bearish for several months.
The time frame for a U.S. stock market downturn is very narrow. It may have allready started as of today 09/28/26. If not, the bulls need to push up any two of the main U.S. stock indices to new all-time highs this week.
Mark
LikeLike