S&P 500 (SPX) short – term Elliott wave pattern implies a large drop developing.
The SPX – 4-hour bar chart courtesy of Trading View illustrates the intraday action since late April 2026.
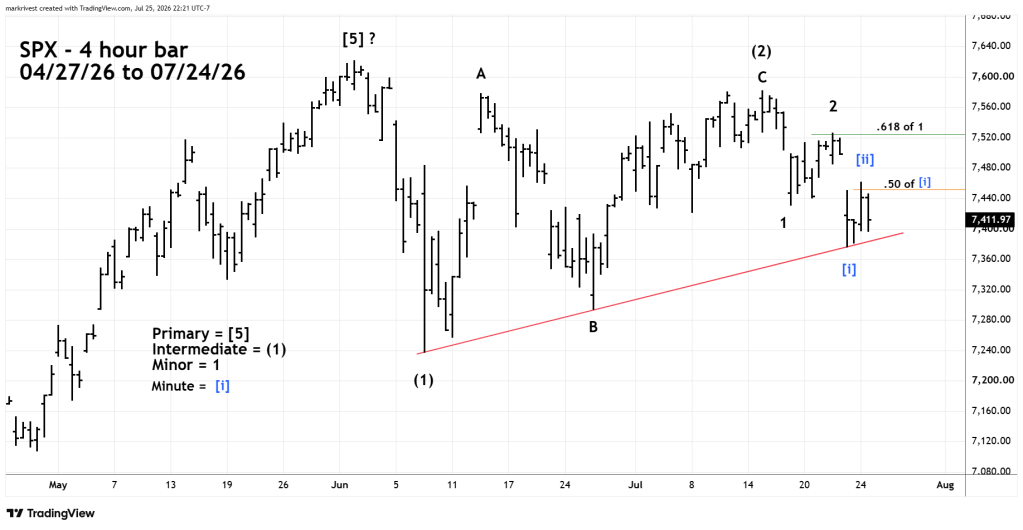
The patterns since the 07/15/26 peak appears to be an Elliott wave series of “one’s” and “two’s” which are usually the prelude strong and steady movements. In this case down.
Please note that the rally labeled Minor wave “2” retraced a little more than .618 of the presumed Minor wave “1” decline. The rally labeled Minute wave [ii] retraced a little more than .50 of the presumed Minute wave [i]. On a very short-term basis the bulls are losing strength.
On the downside watch the rising trendline connecting the 06/09/26, 06/26/26, and 07/23/26 bottoms. A move below this line opens the door for a drop to 7,376.00 which was illustrated in the 07/23/26 blog “Important Support Levels – July 2026”.
The next level to watch is 7,237.85 – also illustrated in the 07/23/26 blog.
July 29,2026 could be an important day. There’s a Full Moon and the U.S.- FOMC announce their decision on short-term U.S. interest rates.

