The large drop of U.S. stocks on 07/17/26 implies an important peak may have been made on 07/15/26.
This website’s prior blog illustrated S&P 500 (SPX) could be completing an Elliott wave – Ending Diagonal Triangle (EDT) from the 06/09/26 bottom. There are always alternate Elliott wave counts. Today’s blog illustrates two alternate counts.
The first hourly SPX chart courtesy of Trading View shows the most likely scenario.
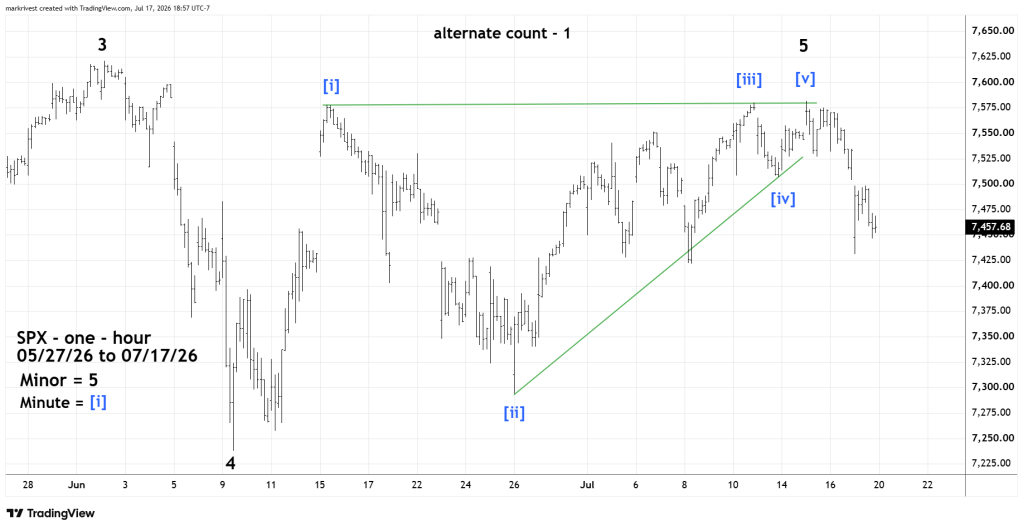
Some practitioners of the Elliott wave theory believe there’s a rule of proportionality. There are guidelines for proportionality not rules. For example, usually the fifth wave of a motive pattern is equal to the first wave. On rare occasions the fifth wave could be just 10% of the first wave.
Please note that the presumed Minute waves [iv] and [v] are small in relationship to the other three sub waves. As Bob Prechter has stated “Form is constant, size will vary”.
When counting Elliott waves the most likely scenario will have proportional sub waves. But, be prepared for low probability alternate wave counts.
The next SPX hourly chart illustrates how the EDT could still be developing.

At 07/17/26 low the presumed Minute wave [iv] had retraced about 52% of Minute wave [iii] which is deep for a fourth wave. The largest fourth wave retracements are about 60%. An SPX move below 7,400 could be a very bearish signal.
 Four Dimension Trading