The 04/18/26 blog “Collapsing Crude Oil? – April 2026” illustrated the bullish and bearish scenarios for Crude Oil. Since then, Crude Oil has trended sideways. Weekly momentum implies a multi-month downtrend may have begun.
The weekly Crude Oil (CL2!) chart courtesy of Trading View shows the long-term picture.
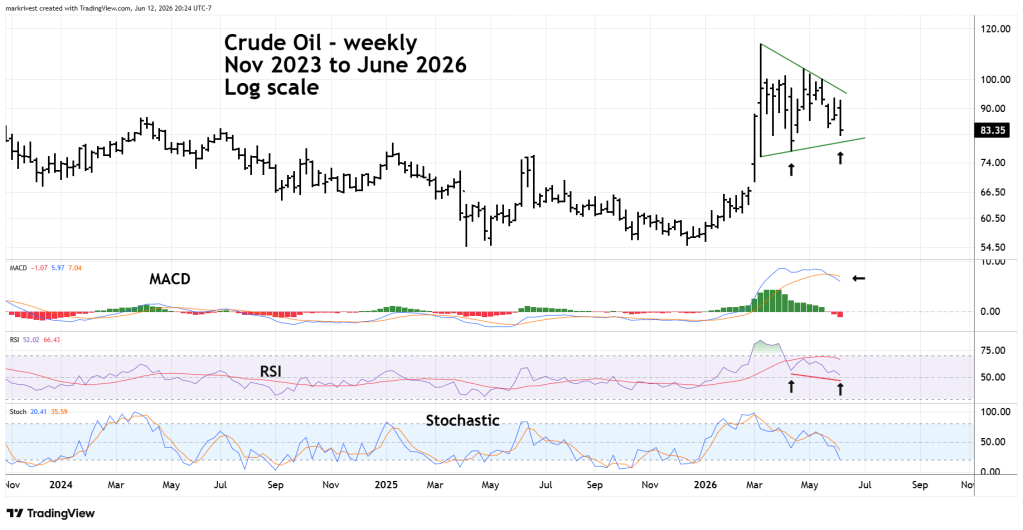
Weekly MACD has a bearish line cross.
RSI has been trending down. Please note the June RSI reading is below its April reading, while June price is above its April bottom. This phenomenon usually forecasts lower prices.
Weekly Stochastic lines are above the oversold zone which begins at 20.00. This implies there’s room for prices to go lower. If weekly Stochastic lines do go into the oversold zone, it could be several weeks before an uptrend resumes.
Watch the rising trendline connecting the March 2026 and April bottoms.
This trendline is now at about 80.00. A break below this trendline could be a powerful bearish signal opening the door for a move down to 55.00.
Crude Oil is seasonally bearish from July to December.
