An important short-term S&P 500 (SPX) peak could be made on 06/12/26
The SPX -30 – minute chart courtesy of Trading View illustrates the intraday action.
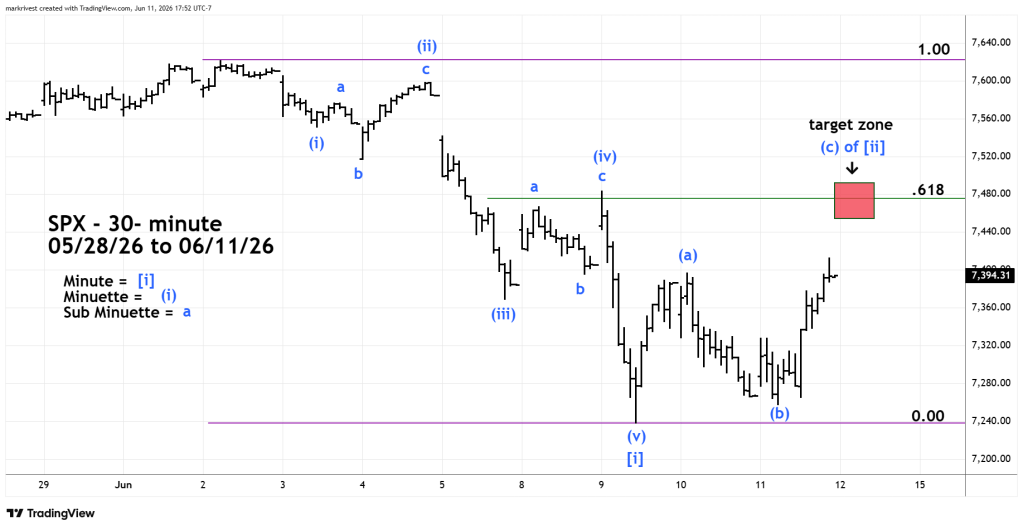
The SPX 06/02/26 to 06/09/26 decline took the form of an Elliott Impulse pattern. If so, this could be the first wave of a larger five – wave pattern down.
Within the presumed Minute wave [ i ] there’s alternation between the second and fourth waves of the five waves down.
Minuette wave ( ii ) is an Expanding Flat
Minuette wave ( iv ) is a Single Zigzag.
If the rally up from the 06/09/26 bottom is not complete, the SPX could rise to a Fibonacci .618 retracement of the 06/02/26 to 06/09/26 decline.
The broad target zone is 7,455 to 7,490. Also note the Fibonacci .618 retracement level is very close to the presumed Minuette wave [ iv ] peak.
The post 06/09/26 rally could terminate on 06/12/26.
