Since February 2026 the Dow Jones Industrial Average (DJI) upside performance has lagged both the S&P 500 (SPX) and the Nasdaq Composite (IXIC). On 05/22/26 the DJI made an all-time high unconfirmed by SPX and IXIC. This action could be a very bearish signal for the U.S. stock market.
The daily DJI, SPX, and IXIC chart courtesy of Trading View illustrates their relationship.
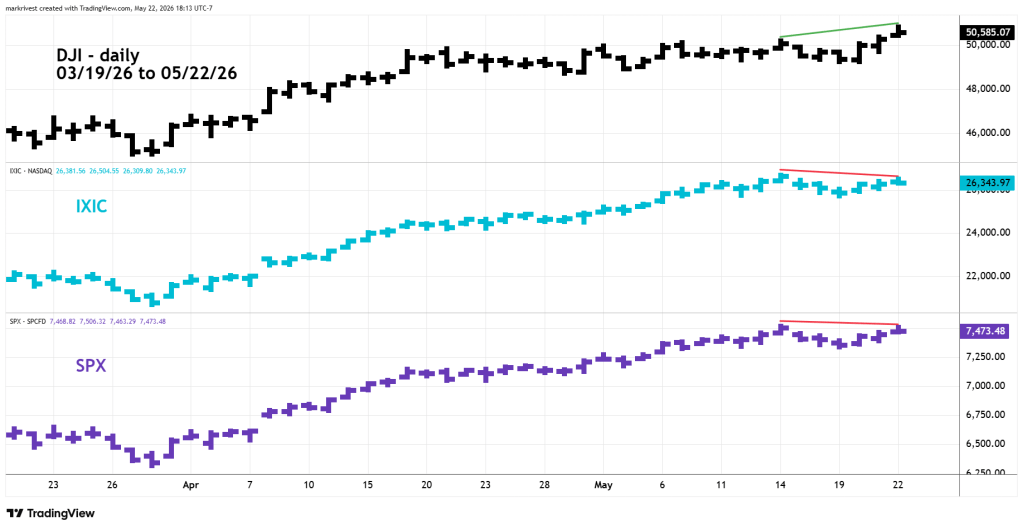
In mid – April 2026 – SPX and IXIC exceeded their all-time highs made in early 2026. DJI did not exceed its February 2026 all-time high until 05/22/26. Note that SPX and IXIC failed to exceed their prior all-time highs made on 05/14/26.
The 05/17/26 blog “Characteristics of a U.S. Stock Market Peak” noted a phenomenon where only one of the three main U.S. stock indices made an all-time high unconfirmed by the other two stock indices. The three main U.S. stock indices are; SPX, DJI, and IXIC.
This phenomenon has occurred at several significant U.S. stock market peaks since January 2000.
The daily DJI chart examines its momentum.
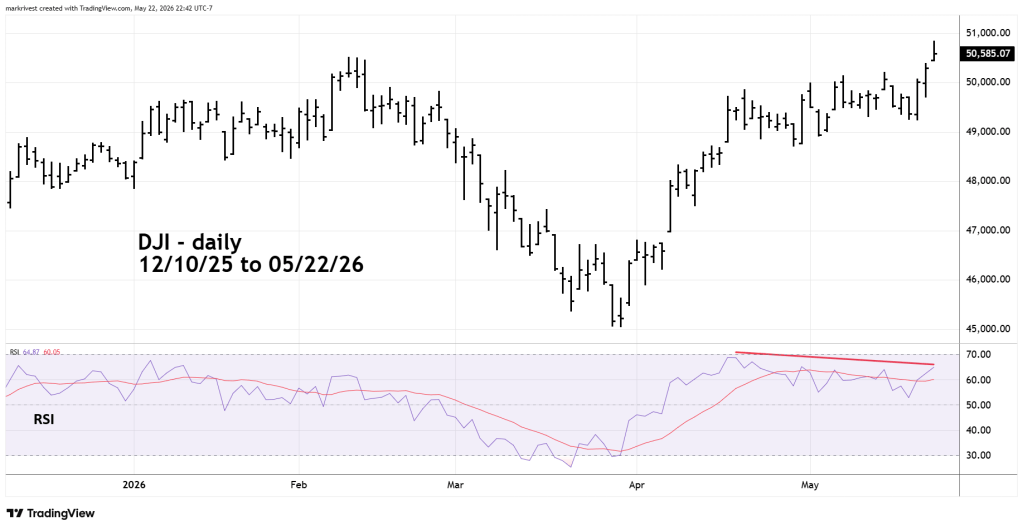
Almost all stock index important tops on any time scale occur with at least one bearish RSI divergence. This characteristic for a DJI peak was made on 05/22/26.
The potential bearish signal made on 05/22/26 will be invalidated if two of the main U.S. stock indices make simultaneous daily all-time highs.
