The 03/22/26 blog “The Case for Higher U.S. Interest Rates – March 2026” illustrated that the CBOE 30 – Year Treasury Bond Yield may have completed a multiyear Elliott wave – Horizontal Triangle at the 02/27/26 bottom. This wave count could be correct; however, there’s an alternate wave count in which the multiyear Horizontal Triangle is still in development.
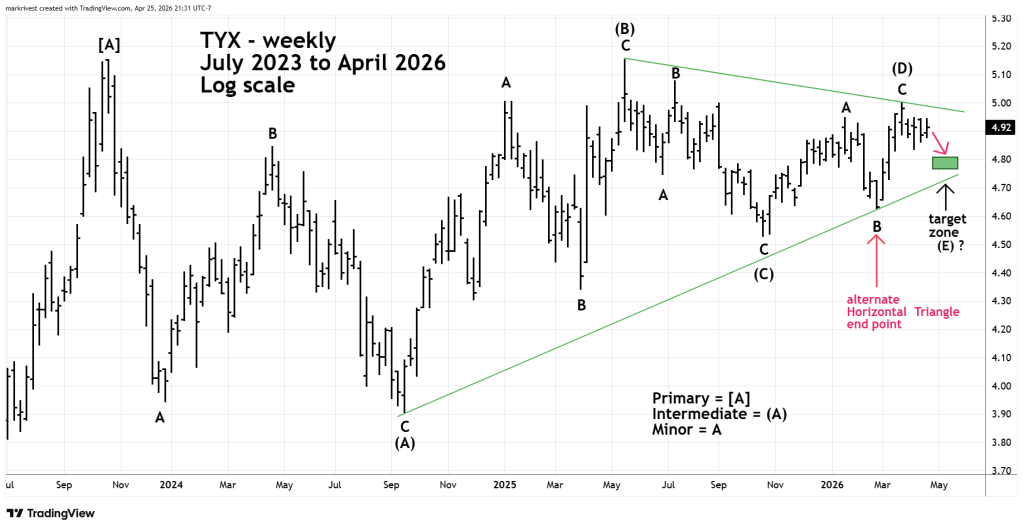
The weekly TYX chart courtesy of Trading View updates the action.
Horizontal Triangles are net sideways correction of the main trend. They are composed of five subdivisions each of which further sub divides into three waves or a combination of three waves. After conclusion of the Horizontal Triangle there’s usually a thrust in the direction of the main trend. For this Horizontal Triangle the main trend is up.
There are usually Fibonacci relationships among the Horizontal Triangle sub waves.
For the TYX – Horizontal Triangle that began in October 2023 they are as follows.
Intermediate wave ( A ) is equal to Intermediate wave ( B ).
Intermediate wave ( C ) is .50 of Intermediate wave ( B ).
Intermediate wave ( D ) is .382 of Intermediate wave ( B ).
The presumed Intermediate wave ( E ) may have completed at the early April 2026 bottom. If Intermediate ( E ) is still developing it could, in the short – term decline to Fibonacci support in the 4.77 to 4.81 area.
Whichever wave count is correct, there’s a high probability the trend for the next several months is up. If so, an important upside break out could occur at TYX – 5.15. This is the double top formed in October 2023 and May 2025.
A multi-month rise in longer term U.S. interest rates would probably have an adverse effect on the U.S. economy and stocks.
