On 04/24/26 two of the three main U.S. stock indices, S&P 500 (SPX), and Nasdaq Composite made all-time highs. This is a bullish movement. The SPX – Elliott wave count from the 03/30/26 bottom gives us a clue of where this index could be in the short-term cycle.
The 60 – minute SPX chart courtesy of Trading View illustrates the movement since the 03/30/26 bottom.
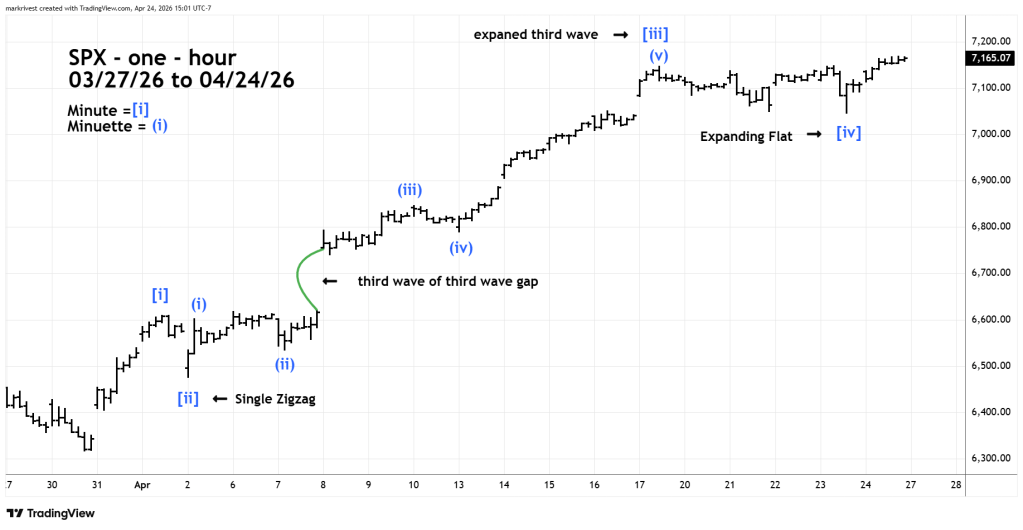
The easiest way to understand Elliott wave theory is, straight lines followed by crooked lines.
Please note the steady and smooth movement of the rally since 03/30/26. On a higher time frame chart, it looks like a straight line. This is the signature of an Elliott wave Impulse pattern.
Within an impulse wave there’s usually alteration between the two main corrective patterns, in this case Minute wave [ii] and Minute wave [iv]. The presumed Minute wave [ii] is an Elliott wave – Single Zigzag correction. The presumed Minute wave [iv] is an Elliott wave – Expanding Flat.
For stocks and stock indices the third waves of Impulse patterns are usually the longest. Within this presumed still developing Impulse pattern, Minute wave [iii] is so far the longest. Minute wave [iii] is also an extended wave, which means you can see the five smaller degree subdivisions. Typically, there’s only one extended wave within an impulse pattern.
When third waves are the longest the third wave of a third wave has the most powerful movement. This is what happened in Minuette wave (iii) of Minute wave [iii].
The 10 – minute SPX zooms in on the action after the Minute wave [iii] peak.
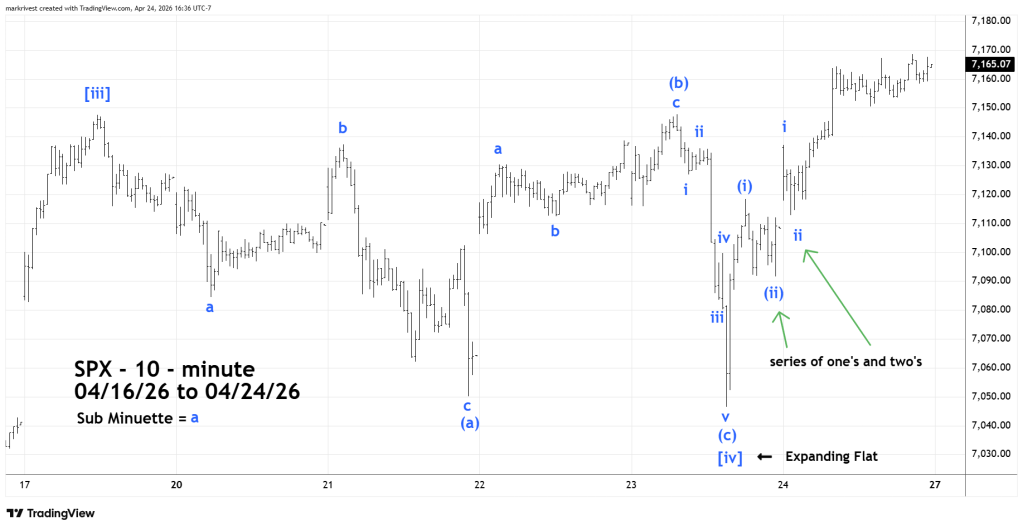
In this case the Expanding Flat is a correction of an uptrend. These structures subdivide into three waves. The first move down can further subdivide into three waves or a combination of three waves. The next move up also further subdivides into three waves or a combination of three waves. Also, the move up moves marginally above the Expanding Flat point of origin. In this case the 04/17/26 peak. The third move is down which subdivides into five waves. This final move down ends marginally below the termination point of the first move down. Illustrated as Minuette wave (a).
For the sake of simplicity, the presumed Minuette waves (a) and (b) are illustrated as Single Zigzags.
After the 04/23/26 bottom there’s an Elliott wave series of “one’s” and “two’s” which is usually the prelude to dynamic action, in this case up.
Based just on the very clear Elliott wave pattern since 03/30/26 there’s a high probability for more upside action going into the week of 04/27/26 to 05/01/26.
Broad upside target zone for a potential peak is 7,230 to 7,330.
Continue to watch the action between the S&P 500 and the Nasdaq Composite. If only one of these indices makes a daily all-time, it could signal an important peak.
