Two of the three main U.S. stock indices, S&P 500, and Nasdaq Composite have recently made all-time highs. However, other major national stock markets have failed to reach new heights. Could the bearish divergences be a warning sign of more downside action in 2026?
The first daily chart courtesy of Trading View illustrates the UK100 and Germany 40 stock indices.
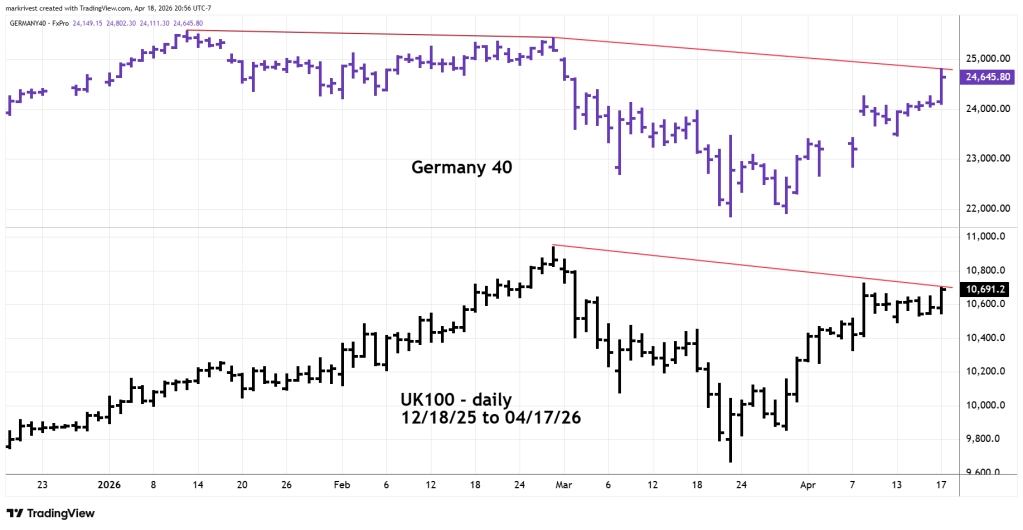
Germany 40 made its ultimate peak in January 2026 then made a lower peak in late February that corresponded with the UK100 all-time high. The UK100 is now only 2.3% below its all-time high vs. Germany 40 which is 3.4% below its all-time high.
The next daily chart shows what’s happened with the Japan 225 and Hang Seng stock indices.
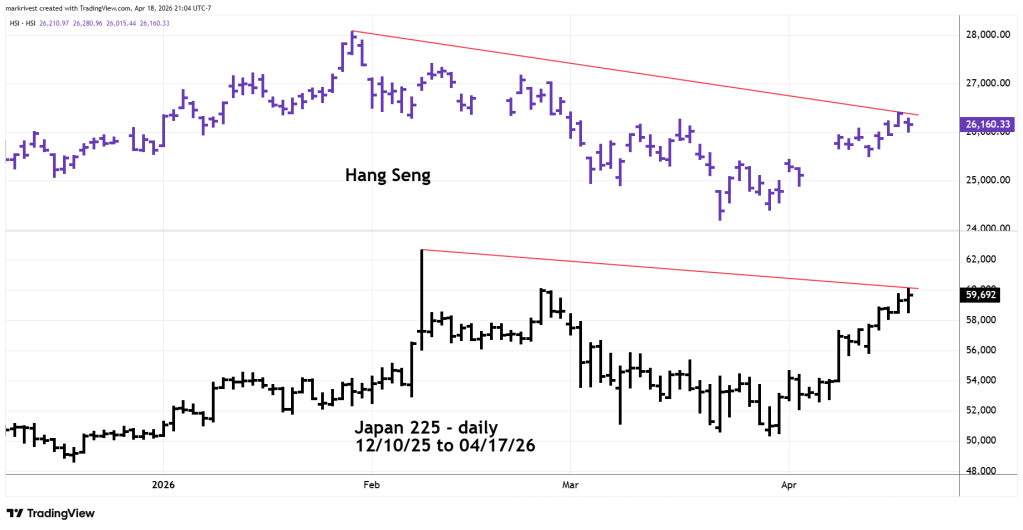
Hang Seng all-time high came in 2018 and has been lagging other national stock indices since then. Its most recent peak in January 2026 was in the broad time zone of other national stock indices peaks. Its relatively weak rally since the bottom in March implies it could continue to have poor upside performance.
Japan 225 upside performance is stronger. This index peaked in February 2026 and is 3.4% below its all-time high.
Of the four indices illustrated the most important to watch is the UK100. If this index can make a new all-time high in April 2026, an international stock bull market could develop.
