Within the prior two trading days Crude Oil declined 15%. Could this be the start of a larger bear movement? Elliott wave analysis examines bullish and bearish scenarios.
The daily continuous Crude Oil chart (CL2!) courtesy of Trading View illustrates the bearish scenario.
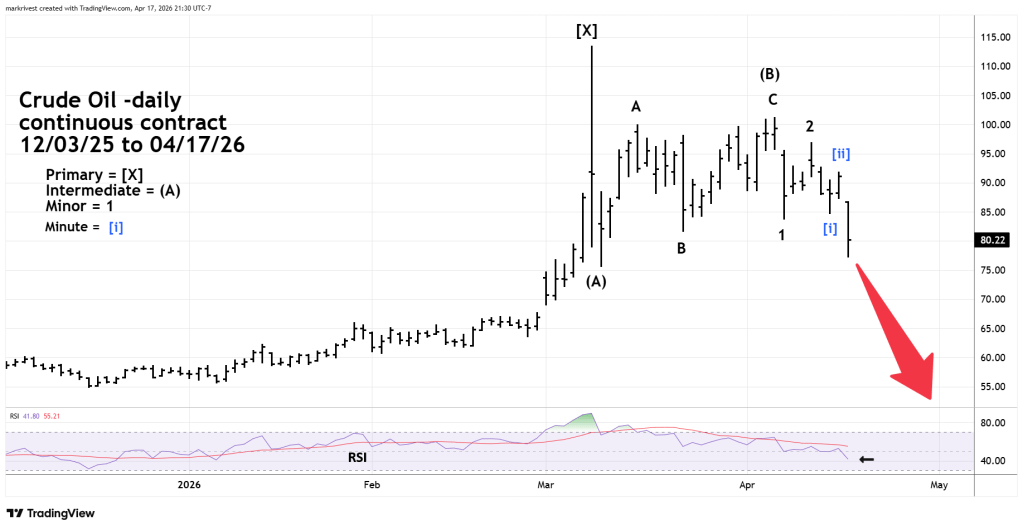
The move down from the 04/07/26 peak labeled Intermediate wave (B) could be an Elliott wave series of “one’s” and “two’s” which are usually the prelude to a dynamic move. In this case down. If this wave count is in effect Crude Oil could drop below 55.00 in a few weeks.
Daily RSI supports this scenario. As of 04/17/26 – RSI was at 41.70 and above the oversold zone which begins at 30.00.
The next daily Crude Oil chart shows the bullish scenario.
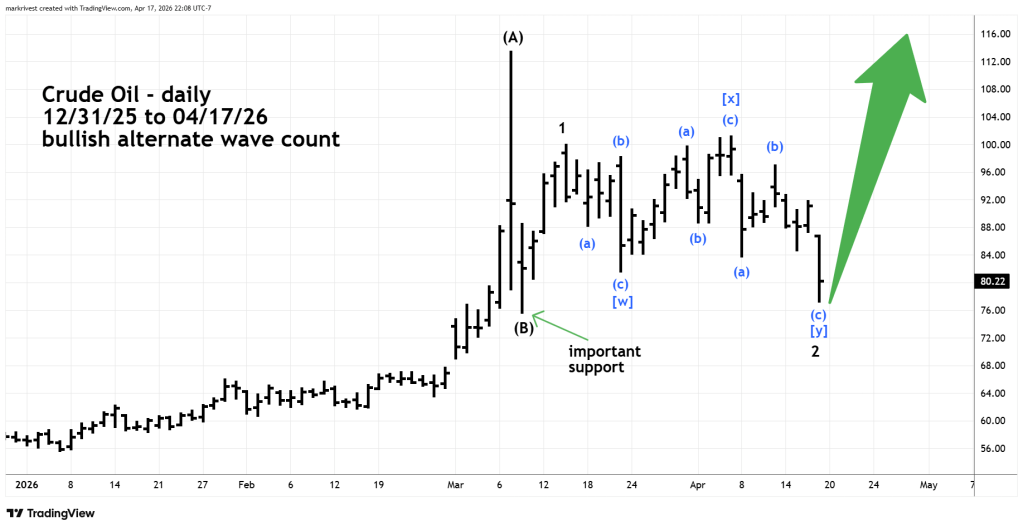
There are always alternate wave counts, this one presumes an important bottom was made on 04/17/26. If this wave count is correct the next rally could exceed the peak made on 03/09/26 at 113.41.
Important support is at 75.64, a break below that level invalidates this bullish wave count. Please note a move below 75.64 would not eliminate a near-term bullish scenario. There’s another bullish alternate wave count, which, if necessary, will be illustrated in a future blog.
The major fundamental factor that will determine price action is the Iran war.
On 04/17/26 it was announced that the Strait of Hormuz was open, which triggered a large drop in Crude Oil.
As of this writing on 04/18/26- Iran says the Strait of Hormuz is closed.
Perhaps the situation could change again.
Crude Oil as of the bottom made on 04/17/26 could be an important junction, a large move in either direction could occur depending on the war situation.
Crude Oil futures begin trading at 6:00 PM – EDT on 04/19/26.
