The 04/09/26 blog “Cease Fire Buying Panic” illustrated the S&P 500 (SPX) had strong resistance around 6,850 to 6,900. It takes powerful buying to break powerful resistance, and that’s what’s happened.
The most important momentum indicator for U.S. stocks is the relationship between the three main U.S. stock indices.
The daily chart of the SPX, Dow Jones Industrial Average (DJI), and Nasdaq Composite (IXIC) courtesy of Trading View illustrates their momentum.
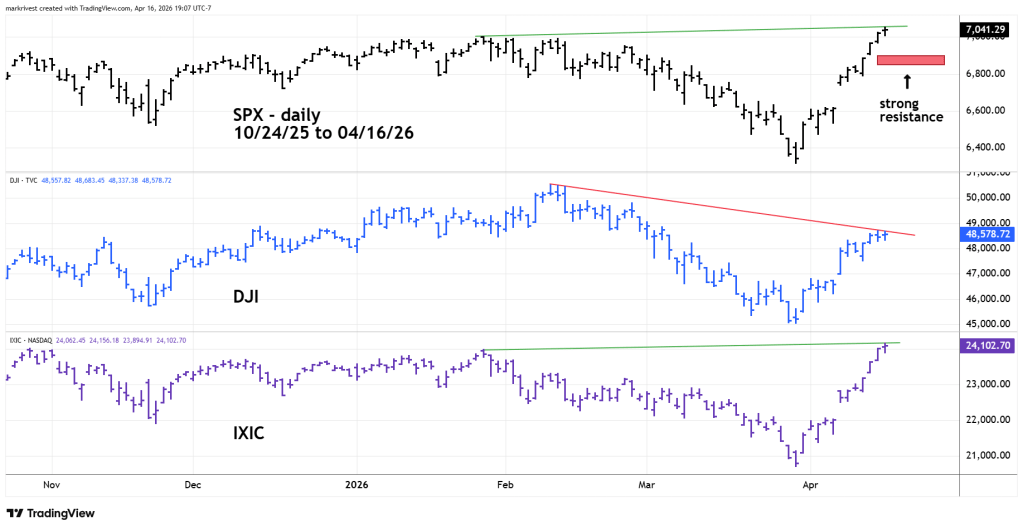
On 04/16/26 SPX and IXIC made new all-time highs. If only one of the three main U.S. stock indices make a new all-time high, it could be a significant bearish momentum signal.
With at least two of the main indices making new heights, the rally is likely to continue.
The strongest part of the rally that began on 03/30/26 came on the announcement of the Iran war cease fire.
Perhaps if the conflict ends it could mark the termination of the post 03/30/26 rally.
This could be analogous to “buy the rumor, sell the news”. In this case the rumor is the cease fire. The news is peace.
Watch SPX, DJI, and IXIC.
