On 07/10/25 the S&P 500 (SPX) moved above the prior weekly high invalidating a bearish Strat combo. However, the new high occurred on a Full Moon with an important daily bearish momentum signal.
The weekly SPX chart courtesy of Trading View updates the long view.
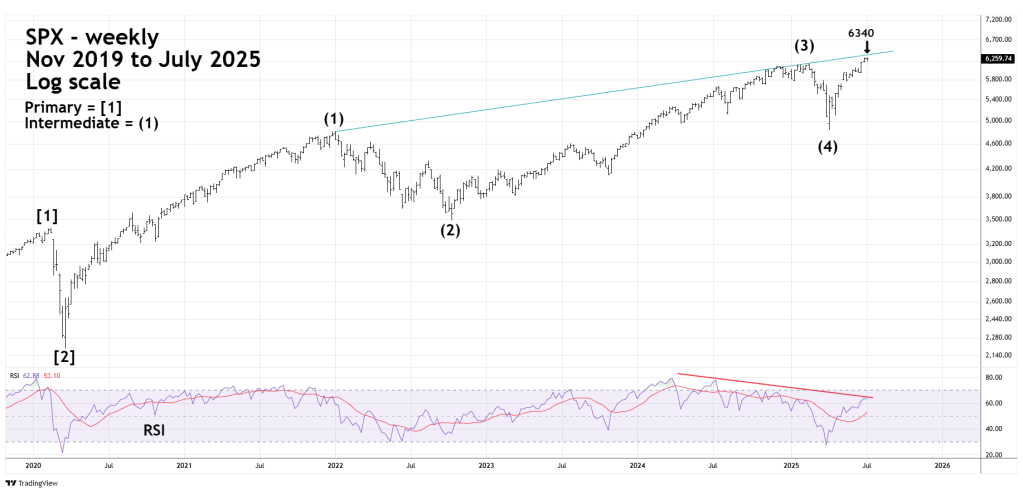
The 07/04/25 blog “Pre Holiday Stock Rally – 07/03/25” illustrated the SPX was nearing a long-term rising trendline connecting the SPX January 2020 and February 2025 peaks. The trendline is near SPX 6,340, the SPX high on 07/10/25 was 6,290, it’s possible the SPX reached leeway around the trendline.
Also please note the significant weekly RSI bearish divergences.
The daily SPX chart examines the shorter-term action.
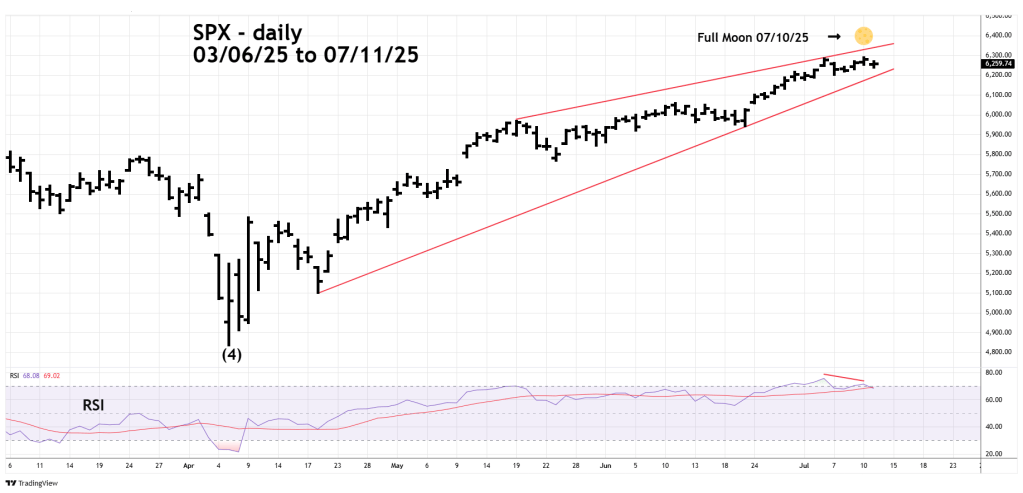
Sometimes markets turn on Full/New Moons plus or minus two trading days. The 06/10/25 SPX new high occurred on a Full Moon. Note the daily RSI bearish divergence on 07/10/25. stock indices usually have turns with at least one RSI bearish divergence.
The potential lunar time zone extends to 07/14/25. The next SPX weekly Strat level to watch is the week of 07/07/25 to 07/11/25 bottom at 6,201.00.
If during the week of 07/14/25 to 07/18/25 the SPX moves below 6,201.00 an important peak could be in place.
