When a major U.S. holiday occurs Monday through Friday the NYSE suspends trading for that day. Occasionally the day before or after the holiday could have a shortened trading day.
The NYSE had shortened trading hours on 07/03/25 because Friday 07/04/25 was the U.S. Independence Day holiday.
Shortened stock trading sessions usually have a very narrow trading range probably because large stock fund managers are taking the day off. In most cases it’s the big money people that trigger large intraday stock movements.
Going into the 07/03/25 session the S&P 500 (SPX) had already rallied 28% since the 04/07/25 bottom. On 07/03/25 the SPX gapped up to a new all-time high, and at its intraday peak was up .91% from its previous day close. This is a considerable accomplishment considering that small money traders could be doing most of the buying.
The daily SPX chart courtesy of Trading View examines another unusual, shortened trading session that occurred in December 2018.
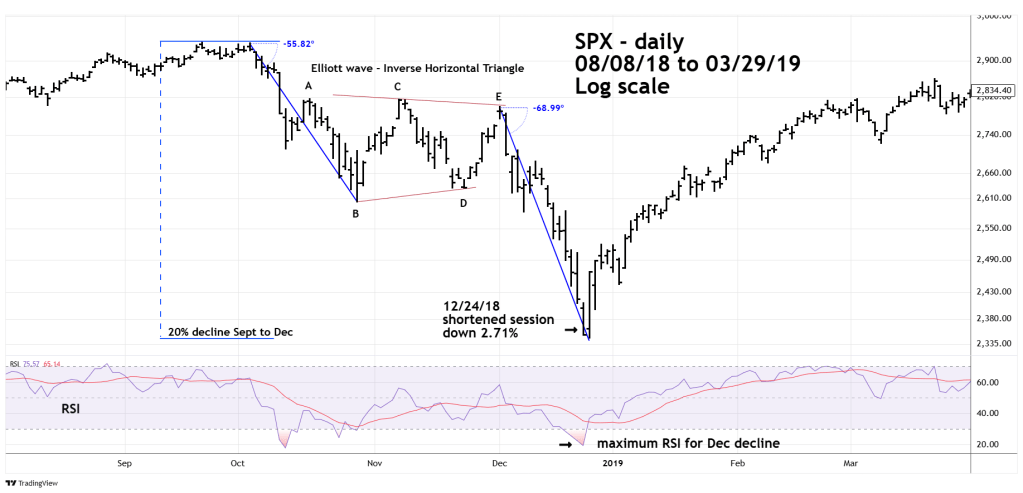
From September to December 2018 the SPX declined 20%. The drop was in three waves with middle wave taking the form of an Elliott wave – Inverse Horizontal Triangle.
Please note that the first part of the September to December bear phase declined to an angle of 55.82 degrees. The second part during December 2018 declined to an angle of 68.99 degrees. This is the typical action of the second part of a bear phase. Most traders recognize the trend is down and are selling more aggressively.
The September to December bear market climaxed on 12/24/18 pre-Christmas shortened trading session down 2.71%.
The next trading day the SPX made a marginal new low then began a new bull market.
What happened on 07/03/25 could be the reverse of the 12/24/18 action. After a steep angle multi-month rally small traders rush in to buy the top.
If the SPX breaks below 6,174.97 during the week of 07/07/25 to 07/11/25 it could signal the start of a multi-month decline.
