The 03/16/25 blog “Forecast – S&P 500 Intermediate Bottom – 04/03/25” illustrated that the S&P 500 (SPX) could bottom around the 08/05/24 mini crash bottom 04/03/25 or 04/04/25.
The 08/05/24 bottom was at 5,119.26, the low SPX low on 04/04/25 was 5,069.90. Evidence from SPX momentum oscillators reveal clues to what could soon happen.
The weekly SPX chart courtesy of BigCharts.com illustrates long-term momentum.
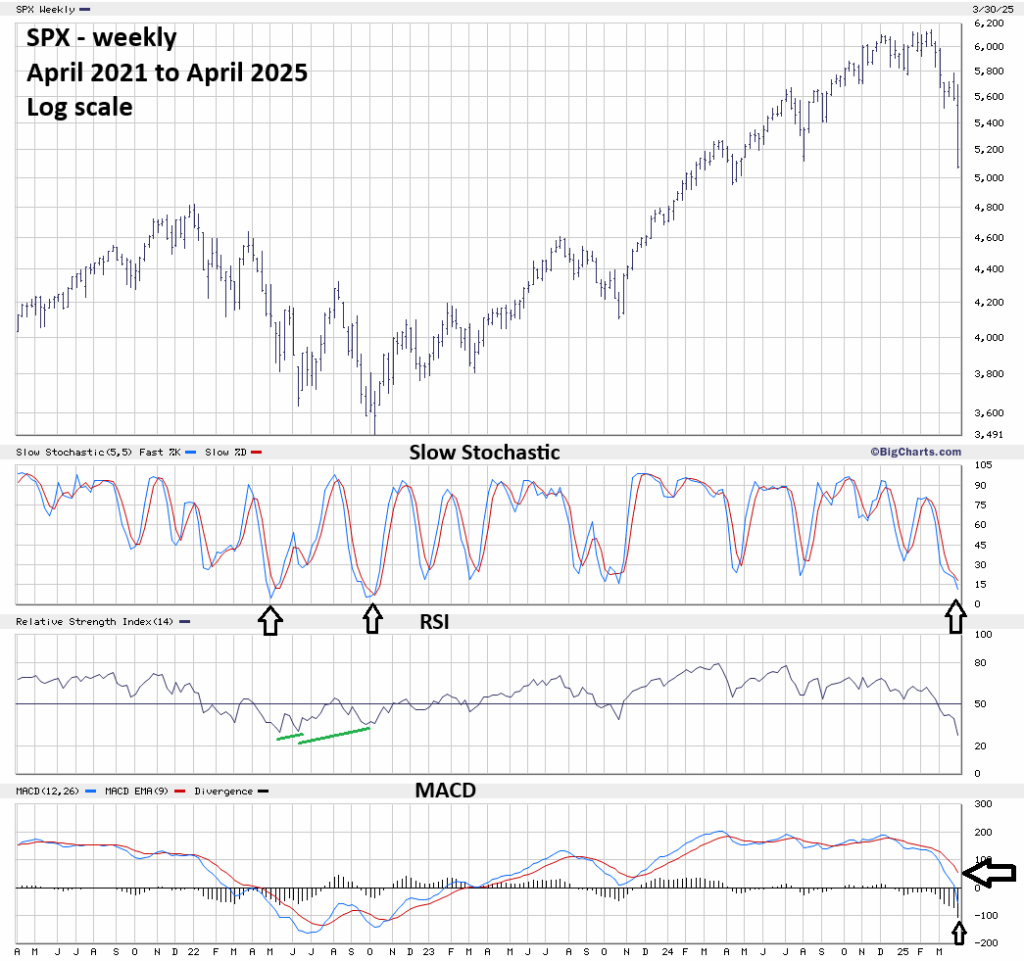
Note that at SPX – May and October 2022 bottoms the Slow Stochastic red line went below the 15 level. As of 04/04/25 the Slow Stochastic red line is above 15 and implies near – term lower prices.
Weekly RSI has gone into the oversold zone which begins at 30.00. So far there’s no bullish divergence. Note the bullish divergences made at the 2022 bottoms.
The message from MACD is mixed. Usually, MACD indicates bottoms when both lines are below the zero level with Histogram bullish divergences. Sometimes bottoms can be made with both lines above the zero level with no bullish divergences. This happened at the SPX October 2023 bottom.
The weight of evidence from the weekly oscillator’s hints at more downside action in the coming weeks.
The next SPX BigCharts.com chart examines the daily action.

The SPX 50 – day Simple Moving Average (SMA) continues to converge with the 200 – day SMA. The lines could cross in eight to nine trading days. Sometimes this convergence called a “Death Cross” occurs at or just after significant stock market bottom.
The 03/30/25 blog “Alternate Time Forecast for Intermediate S&P 500 Bottom” illustrated that there could be an SPX bottom on 04/16/25. This date corresponds with a possible SPX “Death Cross”.
Evidence from daily Slow Stochastic is mixed. The blue line has reached the oversold zone that starts at 20.00 and the red line is still in the neutral zone.
Daily RSI is deep in the oversold zone and implies at least a short-term bounce is due.
MACD lines and Histogram have minor bullish divergences.
If the SPX continues down in the next few weeks, where could a bottom occur? The weekly SPX chart courtesy of Trading View examines an interesting Fibonacci retracement level.

A Fibonacci .50 retracement of the SPX October 2022 to February 2025 bull market is 4,819.50. This level is very close to the SPX bull market peak made in January 2022 at 4,818.62. Sometimes prior resistance levels can become support.
The daily Trading View chart examines another Fibonacci retracement level.

The Fibonacci .618 retracement of the October 2023 to February 2025 bull movement is at 4,884.46 which is above the larger .50 – retracement level of 4,819.50. Also, there’s chart support at the SPX -April 2024 bottom of 4,953.56.
If the SPX does not make an intermediate bottom on 04/04/25 it’s possible an intermediate bottom could be made 04/15/25 to 04/17/25 in the 4,930 to 4,790 area.

Hi Mark, good call on the target! Looks like there’s strong resistance at 4800 at the confluence of the 2022 peak resistance, the March 2020 trendline, and the Oct. ’22 to Feb. ’25 .50 Fib. Maybe a B Wave bounce?
Hi Mike
Thanks. If you mean a bounce off of 4,800 being a “B” wave bounce, it’s possible. First we need to see if SPX can make it to 4,800.
LikeLike