After the election of Donald Trump as U.S. President on 11/05/24 the Dow Jones Industrial Average (DJIA) rallied for 19- trading days. Currently the DJIA is rising just prior to Trump’s inauguration as President on 01/20/25. Could this latest “Make America Great Again” (MAGA) rally be the start of a multi- month bull market or peak soon after 01/20/25?
The 11/07/24 blog “Trump Reelection – Catalyst for a Bull Market” illustrated that momentum readings for U.S. Stocks after Trumps election in 2016 implied a multi – month bull market could be developing. Which is what happened. After the 2016 election the DJIA rallied until January 2018.
The momentum situation for U.S Stocks after the 2024 election was very different. The 11/07/24 blog noted, “The recent weekly readings imply the SPX could be closer to a top than the start of a sustained multi month bull market”.
The rally after 11/05/24 was small, but could it be just the first phase of a larger developing bull move?
The BigCharts.com – daily Dow Jones Industrial Average (DJIA) chart illustrates the action since the November 2024 election.
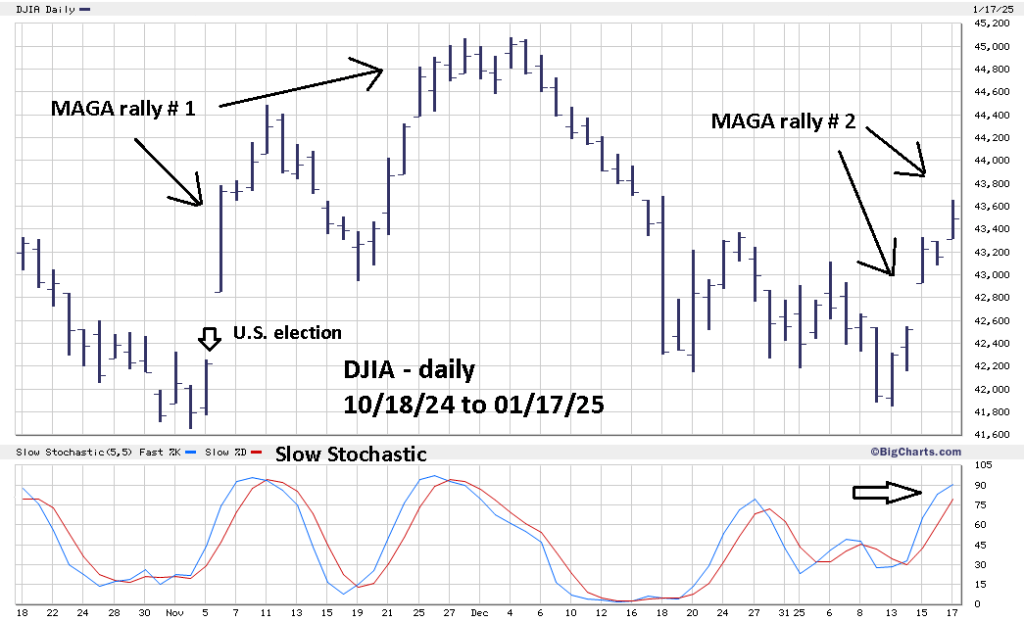
MAGA rally #1 was in two parts separated by a 6 – trading day decline. What happened after the DJIA 12/04/24 peak is very suspicious. In a period of sustained optimism, you would expect any declines to be shallow. The post 12/04/24 decline came close to completely retracing MAGA rally # 1.
The BigCharts.com Slow Stochastic indicator is very effective in identifying trend turning points. Note that both lines have reached the overbought zone above 80.00 implying at least a short – term peak could be nearby.
The 01/18/25 blog “Dow Jones Industrial Average Bearish Elliott Wave Pattern” illustrated fascinating Fibonacci price relationships. There’s also an incredible Fibonacci time relationship.
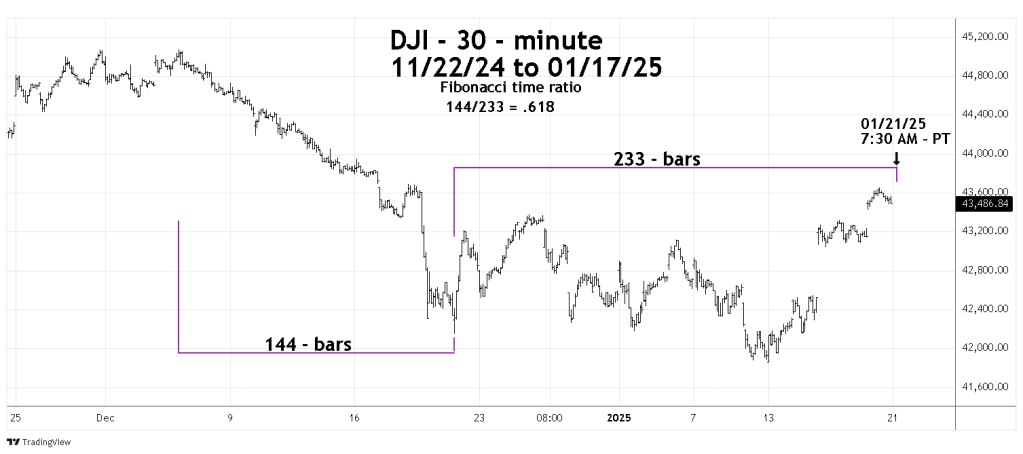
The Trading View 30 – minute Dow Jones Industrial Average (DJI) shows the Fibonacci Time relationship.
There are two ways to do Fibonacci analysis. The first method looks at Fibonacci sequence numbers which are ( 1, 1, 2, 3, 5, 8, 13, 21, 34, 55, 89, 144, 233, 377, – – – to infinity).
The second method examines Fibonacci ratios such as (21/34 equals .618) or (89/233 equals .381).
The 01/18/25 blog illustrated the DJI decline from 12/04/24 to 12/20/24 was a five – wave Elliott – Impulse pattern which is 144 – 30-minute bars, a Fibonacci sequence number.
The phase after 12/20/24 is a presumed developing Elliott wave – Expanding Flat correction. The next Fibonacci sequence number after 144 is 233. Adding 233 – 30-minute bars to the 12/20/24 bottom targets 7:30 AM – PT on 01/21/25 or 10:30 AM – ET.
Inauguration day 01/20/25 coincidently comes on Martin Luther King Day which is a U.S. federal holiday, therefore no stock trading on 01/20/25.
The 01/18/25 blog illustrated potential major Fibonacci resistance in the DJI 43,840 area.
If the DJI rallies into the 43,840 area sometime around 10:30 AM – ET on 01/21/25 a significant peak could be made.
One final note on Fibonacci analysis. It’s not necessary for the Fibonacci ratio components to be Fibonacci sequence numbers. It could be a Fibonacci ratio of non-Fibonacci sequence numbers, such as 27/44 equals .613.
That the DJI 12/04/24 to 12/20/24 decline was a Fibonacci sequence number – 144 adds weight to the evidence that an Expanding Flat correction could terminate sometime early in DJI trading session 01/21/25.
