Gold could make a bottom very late in 2024 or early 2025.
The daily Gold Continuous Futures (GC1!) courtesy of Trading View illustrates its action since March 2024.
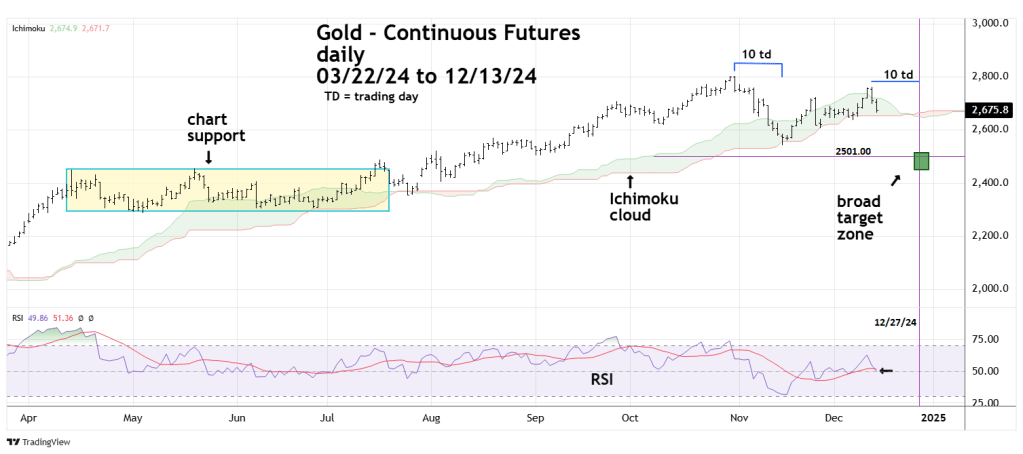
On 10/31/24 Gold Futures peaked at 2,801.20, the subsequent 10 – trading day decline was a five – wave Elliott Impulse pattern. If so, this could be the first wave down of a larger developing bear move.
From the 11/14/24 bottom at 2,541.50 Gold rallied to a secondary peak on 12/12/24 at 2,761.30, the subsequent drop was sharp and could be the start of the next wave down.
Its possible that Gold is forming an Elliott wave Single Zigzag decline from the primary top made on 10/31/24. In Single Zigzag patterns the first decline is usually equal in time and price to the second decline.
The first drop from 10/31/24 to 11/14/24 was 10 – trading days and 259.70 points.
Adding 10 – trading days to the secondary peak on 12/12/24 targets 12/27/24 as a termination time for the decline.
Subtracting 259.70 points from the 12/12/24 peak at 2,761.30 targets 2,501.60 as a bullseye target bottom.
Please note the narrow trading range from April to July 2024. This chart support could be a magnet for prices to go below 2,501.60. The broader support zone could reach down to 2,450.00. Time zone could extend into very early 2025.
Daily RSI on 12/13/24 was 49.86, the oversold zone begins at 30.00. If the decline resumes the RSI oversold zone could be reached by the end of 2024.
There could soon be an important signal from the Ichimoku cloud indicator. Please note that since 06/26/24 the lower band has marked support. The breaks below the lower band have been marginal. A decisive break below the lower band it implies more decline.
