With anticipation of a U.S. FOMC short -term rate cut next week, longer – term U.S. rates are rising.
The weekly CBOE 30- Year Treasury Bond Yield (TYX) chart courtesy of Trading View illustrates the long-term Elliott wave count.
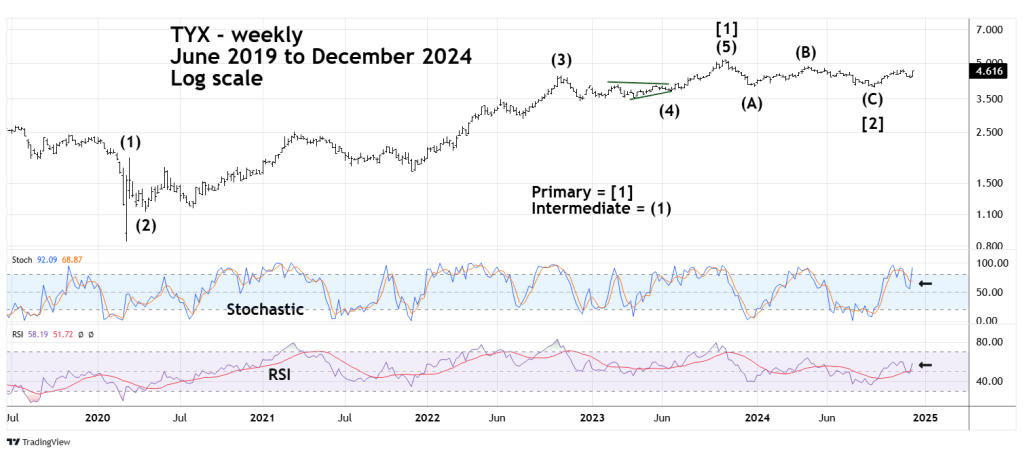
From March 2020 to October 2023 TYX rallied in a clear five wave extended Impulse pattern. If the count is correct this movement could be just the first wave of a larger bull market continuing for several years.
From October 2023 to September 2024 TYX declined in a clear Elliott wave – Single Zigzag. If this corrective pattern is complete it implies that Primary wave [3] is developing, which could ultimately move TYX far above its October 2023 peak.
So far only one line of weekly Stochastic line has reached the overbought zone above 80.00. Please note the prior instances when both lines were in the overbought zone. TYX was able to rally for several weeks before a decline occurred.
Weekly RSI is currently at 58.19 deep into the neutral zone. TYX could have a significant rally before weekly RSI reaches the overbought zone at 70.00.
The daily TYX chart shows shorter – term momentum.
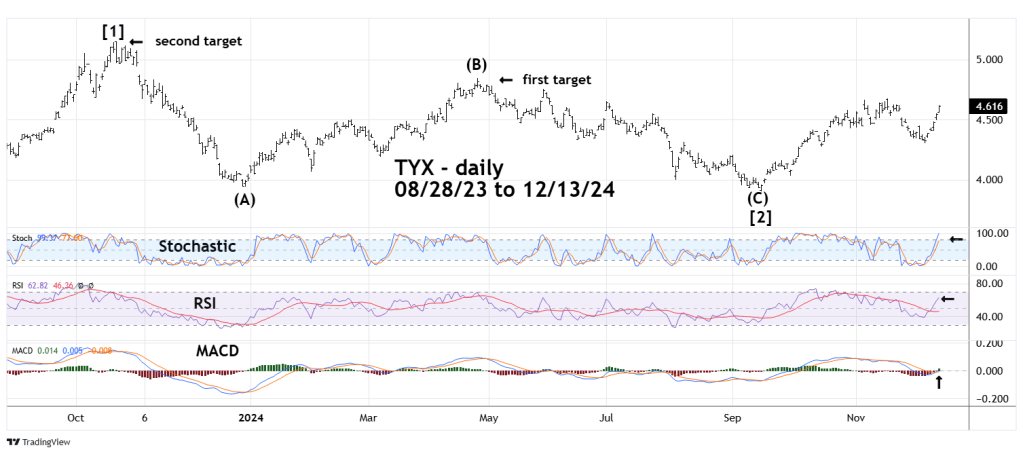
Daily Stochastic, like the weekly has only one line in the overbought zone. Again, please note the prior instances when both lines reached the overbought zone. TYX could rally for two or three weeks before declining.
Daily RSI is at 62.82 implying more rally before reaching the overbought zone.
The most bullish signal is from the daily MACD which just had a bullish lines cross. MACD is a slower moving oscillator. Many times, a line cross can signal the beginning of a significant movement. In this case up.
If the TYX rally continues the first important resistance level is the 04/25/24 peak at 4.846. If that peak is exceeded the next target is major resistance at the 10/23/23 high of 5.152.
The next daily TYX chart examines the short-term Elliott wave pattern.
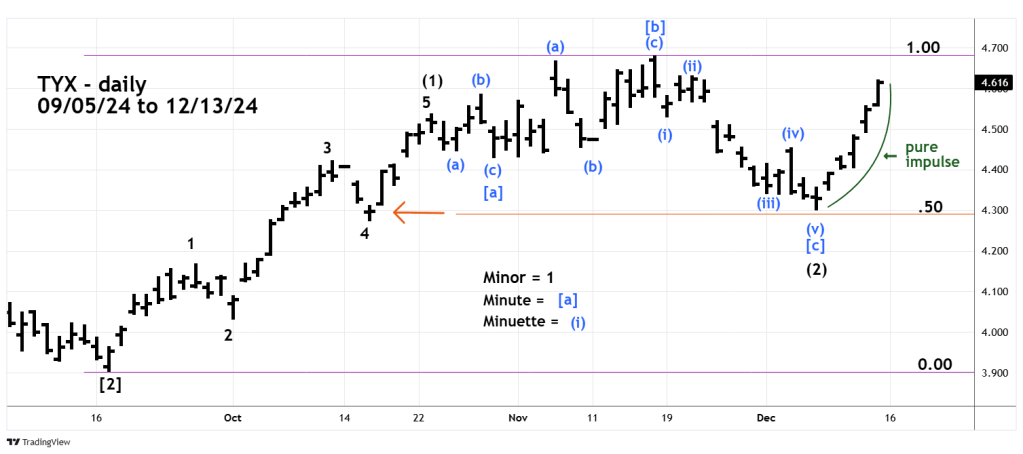
Since the major TYX bottom in March 2020 the long and short – term Elliott wave patterns have been clear. This was true in the recent rally from 09/16/24 to 10/23/24 which was a clear five wave Impulse pattern designated as Intermediate wave (1). Subsequently the rally was choppy – the signature of corrective patterns.
If so, this could mean the September to November 2024 rally was a correction to the October 2023 to September 2024 decline. This scenario opens the door for a TYX move below the September 2024 bottom.
In Elliott wave there are always alternate counts. The movement after the 10/23/24 top appears to be an Elliott wave – Expanding Flat correction. This pattern is divided into three waves. The first wave “a” subdivides into three waves. The second wave “b” also divides into three parts. The final wave “c” divides into five waves.
A fascinating aspect of this pattern is that the first part – labeled Minute wave [a] is itself a smaller version of an Expanding Flat. The subsequent choppy rally moves above the Intermediate wave (1) peak – a characteristic of Expanding Flats. The following decline is a five-wave structure that bottoms below the termination point of Minute wave [a], also a characteristic of Expanding Flats.
The presumed Intermediate wave [2] bottomed out near a Fibonacci 50% retracement of the September to November rally. Also, in the area of the fourth wave of one lesser degree.
Expanding Flat corrections imply a powerful movement of the primary trend which in this case is up. With Expanding Flats, even though they are correcting the prior up trend, they still manage to make upward progress. Think of it as an impatient bull.
The subsequent move up from the 12/06/24 bottom has been very bullish. The rally has been very smooth and steady, quickly moving beyond the Fibonacci .618 retracement of the prior decline. I call this type of movement “pure impulse”.
Momentum and price evidence suggests that whatever the TYX short -term reaction is to the upcoming FOMC decision, a strong bull trend is probably in development.
If TYX moves above the 10/23/23 high at 5.152 it could reach 7.00% or 8.00% sometime in 2025.
