Momentum indicators imply the Nasdaq Composite (IXIC) may have begun a decline of at least 10%.
The daily IXIC chart courtesy of Trading View updates external momentum.
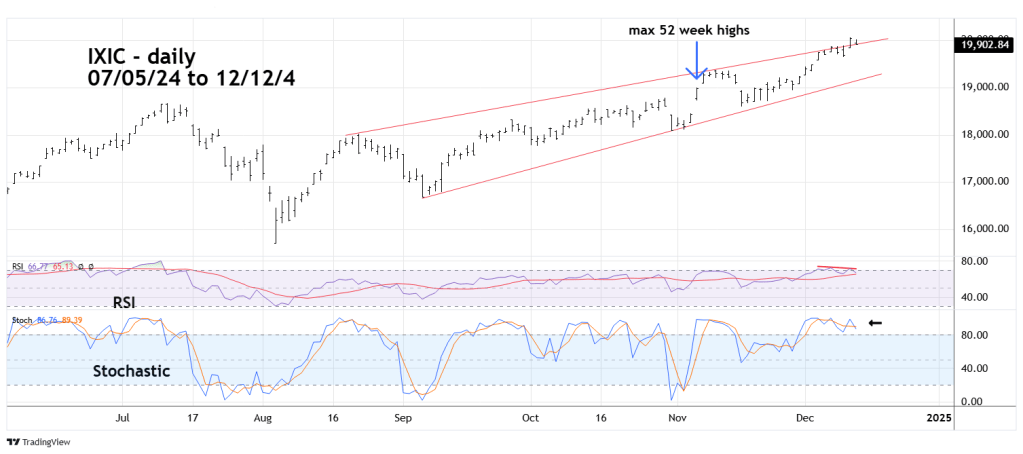
This websites prior blog noted that IXIC had made a new all-time high without a daily RSI bearish divergence. On 12/11/ IXIC made a new high, RSI had a bearish divergence in the overbought zone.
Daily Stochastic had a second bearish lines cross in the overbought zone.
Maximum internal momentum occurred on 11/06/24. The Nasdaq – 52 – week high chart courtesy of Barchart.com illustrated this bullish surge and the subsequent collapse.
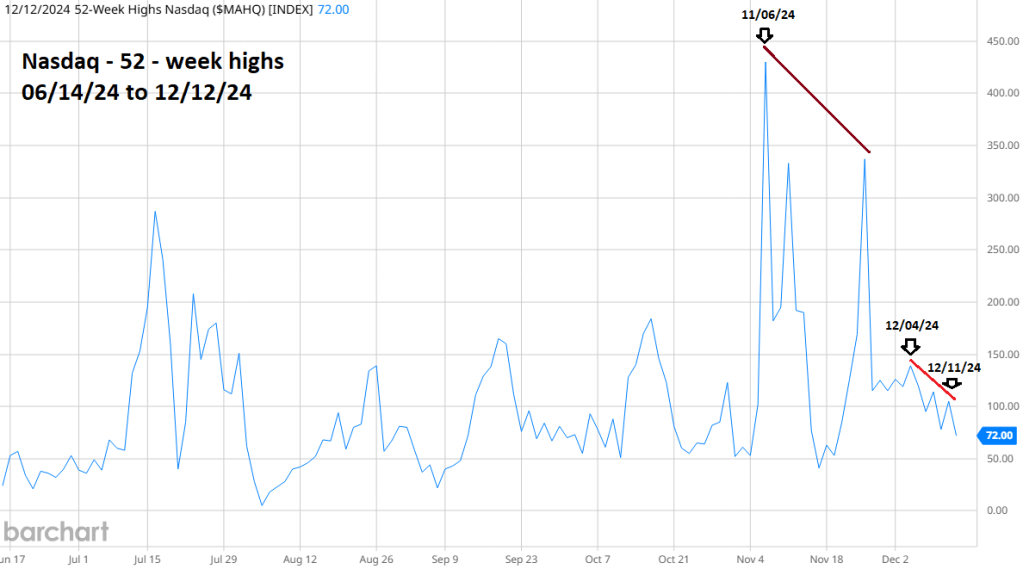
In a little more than a month Nasdaq – 52-week highs have collapsed. Much of the rally on 12/11/24 probably came from the “Magnificent Seven” stocks, five of which made new highs that day.
The only thing stopping the bears from dominating the near- term action is a surprise upward momentum surge. This phenomenon happened in mid – July just prior to the IXIC peak on 07/11/24, subsequently IXIC had a three-week 15% mini crash.
