On 08/16/24 the S&P 500 (SPX) came within 4.19 points of completing a presumed Inverse Expanding Flat correction. This pattern could be complete in the next three trading days.
The one – hour SPX chart courtesy of Trading View updates the action from the all-time high made on 07/16/24.
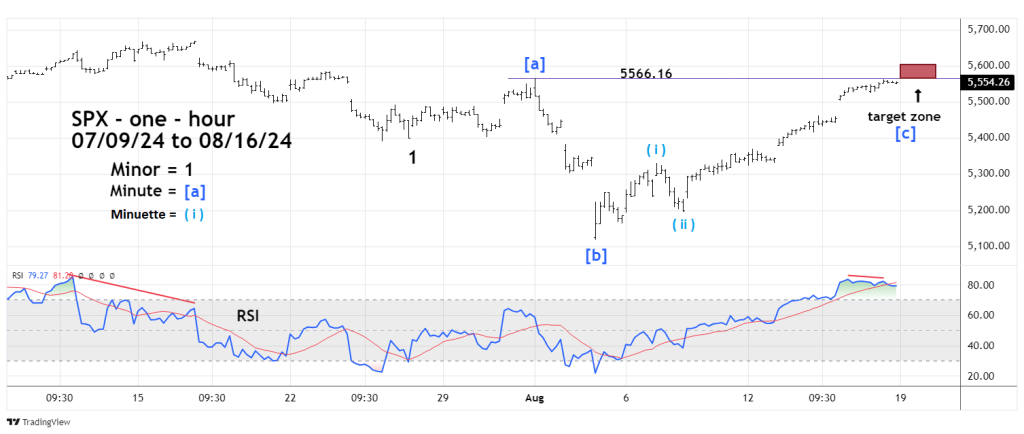
The 08/15/24 blog “S&P 500 – Short – Term Elliott Wave Count – 08/15/24” illustrated that the one – hour SPX – RSI had so far only a small bearish divergence, as of 08/16/24 the momentum situation is the same. The most likely scenario is for a larger bearish divergence. This could happen if the SPX has a multi – hour decline followed by a new post 08/05/24 rally high.
This would be an ideal scenario, sometimes ideal does not happen.
There are always alternative Elliott wave counts. The 08/15/24 blog noted that a five-wave impulse pattern from the 08/05/24 bottom could develop, and that a fourth wave down followed by a fifth wave up was the most likely scenario. Based on proportion to the presumed second wave of the post 08/05/24 rally, the fourth wave should be about the same size as the second wave.
Proportionality is a guideline not a rule. It’s possible one of the tiny declines after 08/12/24 could be the presumed wave four of the post 08/05/24 rally. If this scenario develops there may only be a small hourly RSI bearish divergence when the rally terminates.
There’s also another alternate Elliott wave count to consider.
In the presumed Inverse Expanding Flat wave count, the post 08/05/24 rally – Minute wave [c] needs to terminate marginally above the peak of Minute wave [a] at 5,516.17.
It’s possible an Inverse Running Flat could develop. This wave count is the same as an Inverse Expanding Flat except in this case Minute wave [c] terminates below the peak of Minute wave [a]. This is a rare and potentially very bearish formation.
Sometimes markets can turn on New/Full Moons plus or minus two trading days. There’s a Full Moon on 08/19/24. Its possible an SPX top could be in place as of the 08/16/24 high. If not the time zone for a potential SPX peak is from 08/19/24 to 08/21/24.
Broader seasonal patterns for U.S. stocks are bearish from late August into October. Classic examples of this phenomenon happened in early September 1929, late August 1987, and early September 2000. Anything can happen in the markets. Traders need to be prepared for all contingencies
