The 04/21/24 blog ”Potential S&P 500 Bottom – Early May 2024” noted a Fibonacci time cycle turn on 05/03/24. It was presumed that the S&P 500 (SPX) which began to decline in early April would continue dropping into early May. Subsequently the 04/27/24 blog noted that the size of the SPX rally since 04/19/24 made a forecasted bottom on 05/03/24 a low probability.
Fibonacci time cycles indicate potential market turns. The direction of the market going into the potential turn date implies a top or a bottom.
The daily SPX chart courtesy of Trading View shows the Fibonacci time cycle and what’s happened.
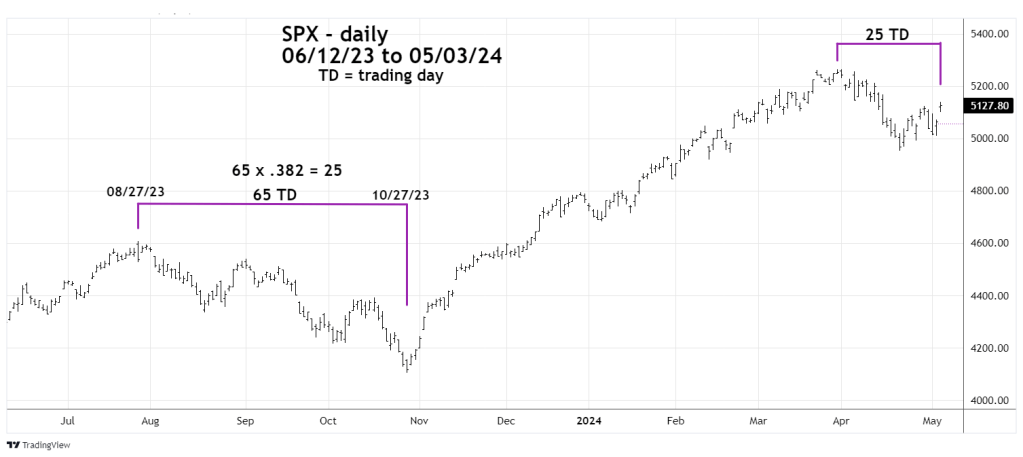
happened.
The August to October decline was 65 – trading days multiplied by the Fibonacci ratio of .382 equals 25 – trading days. There are various ways to analyze potential Fibonacci time turns. Sometime a Fibonacci time segment can be used to forecast a move from a peak to a bottom. A time segment could also forecast the distance between two tops or two bottoms.
In this case there could be a relationship between the 03/28/24 top and a possible peak made on 05/03/24.
Fibonacci time cycles have a greater chance of being correct if a market is also in proximity to a Fibonacci price level.
The hourly SPX chart illustrates a potential Fibonacci resistance level.
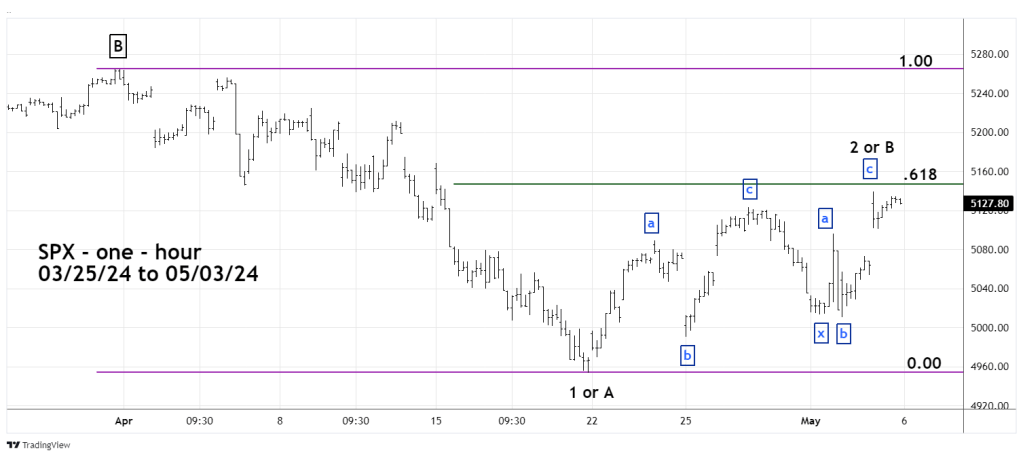
Just like the Russell 2000 illustrated in the prior blog, the SPX has come very close to hitting a Fibonacci .618 retracement of the late March to April decline. If the SPX soon has a strong move above the .618 retrace level – it could rally up to the peak made on 03/28/24. A strong move down in the next one or two trading days implies a move to at least the 04/19/24 bottom.
Seasonal U.S. stock market patterns are also a factor. All three of the main U.S. stock indices ended the month of April down from March. April seasonally ends up from the prior month. The unseasonal price action in April could be a hint of additional downside action for most of 2024.
May is a seasonally bearish month. “Sell in May and go away” is not a stock market cliché, it’s backed up by statistical evidence.
Fibonacci time/ price analysis and seasonal patterns indicate the U.S. stock market decline could resume next week.
