Momentum and Fibonacci evidence indicates U.S stocks may have made at least an intermediate top.
After the 12/20/23 micro crash in U.S. stocks it appeared that an intermediate peak could be in place. Incredibly all three of the main U.S. stock indices continued to rally and moved above their respective pre micro crash highs.
The daily S&P 500 (SPX) chart courtesy of Trading View updates two external momentum indicators.
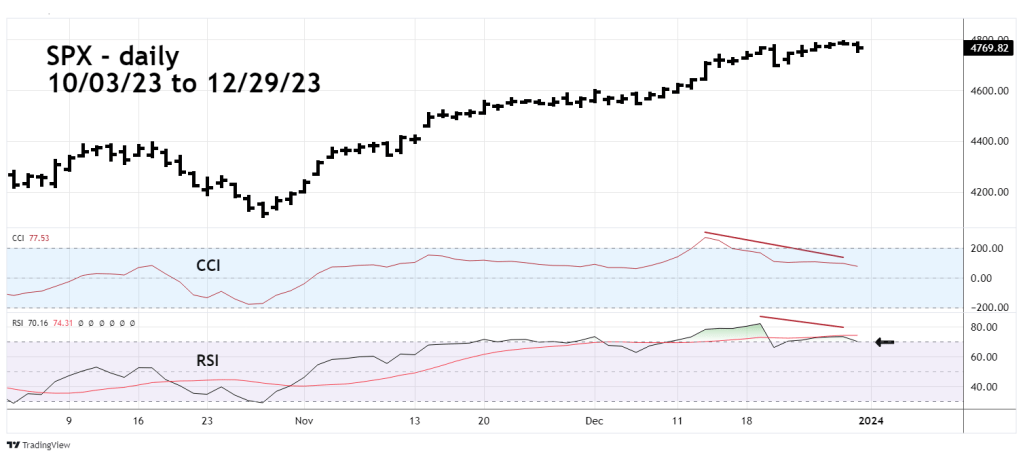
Just prior to 12/20/23 the CCI had a bearish divergence while the RSI was deep in the overbought zone. At the 12/28/23 SPX high, CCI continued to wane while the RSI made a bearish divergence in the overbought zone. Also note the RSI failure to move back above its moving average line.
The daily NYSE – 52 – week highs chart ($MAHN) courtesy of BarChart.com illustrates internal momentum.

Maximum NYSE internal strength occurred on 12/14/23 one day after the FOMC interest rate announcement. The reading made on 12/27/23 one day before the NYSE and SPX rally highs had a significant bearish divergence.
Of even greater importance is the $MAHN level on 12/29/23, is below the 12/21/23 reading. The effects of the micro crash on 52 – week highs were recorded on 12/21/23. The NYSE and SPX indices lows on 12/29/23 were above their respective 12/21/23 highs. Lower 52 – week highs with higher indices prices implies a bearish momentum shift.
The next daily SPX chart reveals some mind-boggling Fibonacci price and time relationships.
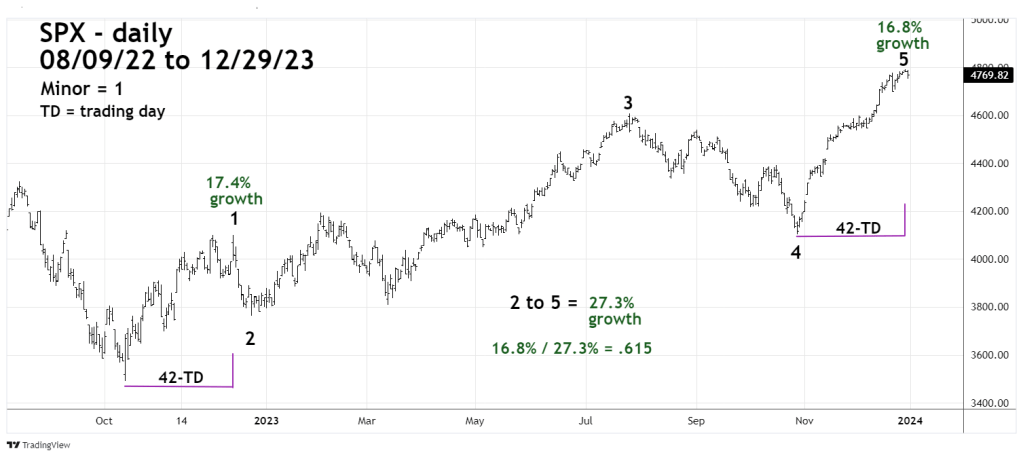
Previous SPX – Elliott wave counts on this website have illustrated that the rally from October 2022 as a developing Double Zigzag. The alternate wave count currently illustrated shows the rally as Impulse wave. The main reason this is not the primary wave count are the subdivisions of the presumed Minor wave “3”.
While there’s doubt as to the wave count, the Fibonacci price/time relationships within the October 2022 to December 2023 rally are clear.
In Elliott – motive patterns there’s usually Fibonacci price/time relationships between sub waves “one” and “five”.
The 10/13/22 to 12/13/22 presumed Minor wave “1” was 42 – trading days (TD).
The 10/27/23 to 12/28/23 presumed Minor wave “5” was 42 -TD, a bullseye hit for the Fibonacci 1/1 ratio!
When measuring movements where there’s been a large percentage gain its usually more effective to compare growth rates rather than points.
The presumed Minor wave “1” had a growth rate of 17.4%.
The presumed Minor wave “5” had a growth rate of 16.8%, nearly equal growth rates.
There’s even a Fibonacci ratio between Minor waves “3” through “5” and Minor wave “5”.
The growth from the Minor wave 2 bottom to the Minor wave “5” top is 27.3%.
The growth of Minor wave “5” is 16.8%.
16.8%/27.3% equals .615, very close to the Golden Fibonacci ratio of .618.
The powerful momentum evidence combined with Fibonacci price/time relationships strongly suggests at least an intermediate peak for U.S. stocks could be in place.
But wait, there’s more evidence – to be revealed in the 12/31/23 blog.
