On 12/08/23 the S&P 500 (SPX) moved above it’s 12/01/23 high and the top made on 07/27/23. Corresponding with the new SPX – 2023 high was a new low in the S&P 500 – Volatility Index (VIX). The new VIX low implies U.S. stocks could rally into early January 2024.
The daily SPX chart courtesy of Trading View updates the action.
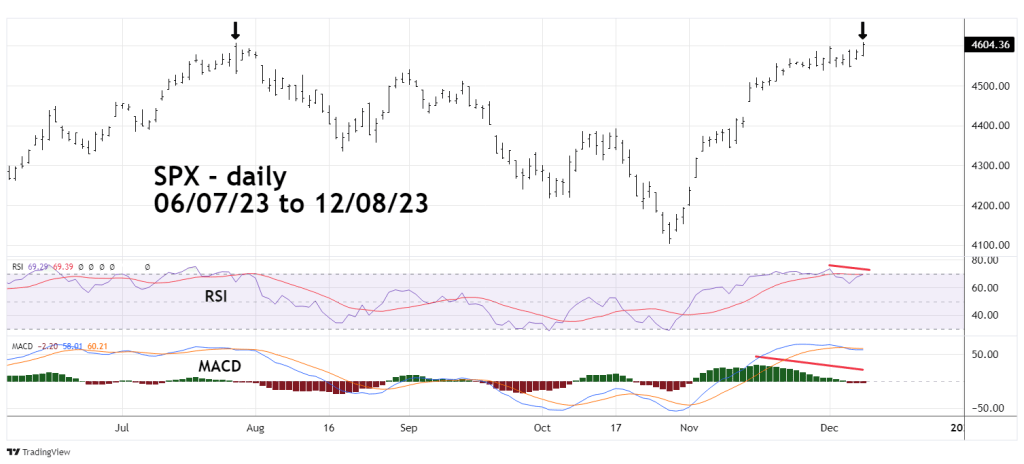
It appeared the SPX may have made an intermediate top on 12/01/23, as it turns out this was just a minor top.
The breakout to a new SPX – 2023 high also came with bearish divergences on the RSI and MACD. If these signals are effective, a subsequent downturn could be brief.
The daily VIX chart illustrates a sentiment signal that could be more important than the message from the momentum oscillators.
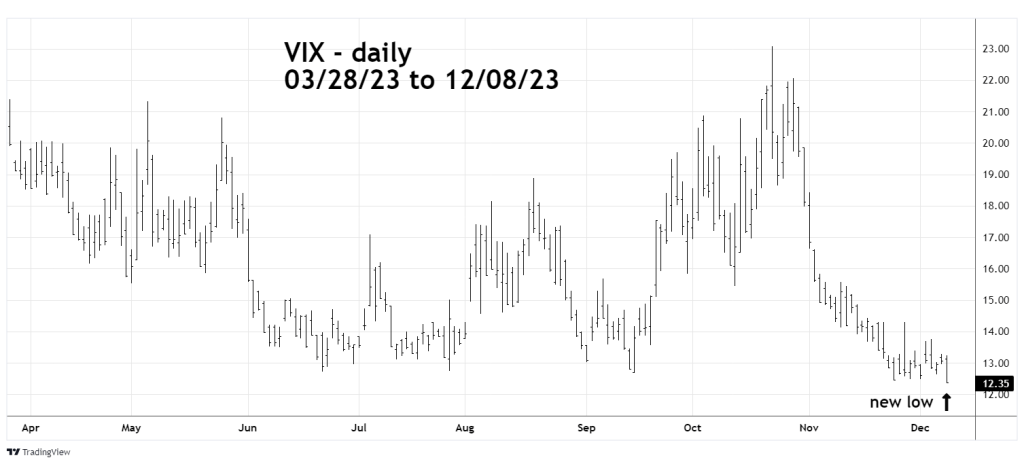
The 11/5/23 blog “VIX Makes a New 2023 Low – 11/24/23” illustrated that when the VIX makes a new primary bottom, the SPX has a primary top several weeks later. The SPX primary peak corresponds to a higher VIX bottom. This is an example of a shift in market sentiment. VIX at a higher bottom indicates a decrease in bullishness.
This phenomenon has been very effective for several years. The VIX making a new low on 12/08/23 indicates there’s a high probability the SPX could exceed its 12/08/23 high. If so, based on prior VIX bottoming action an SPX final rally high may occur late December/early January. This also corresponds with the phenomenon of markets turning on the cusp of a new year. Please see the SPX and Dow Jones Industrial Average (DJI) in early January 2022.
Another bullish signal occurred on 12/08/23 when the DJI exceeded its 12/06/23 high, eliminating a bearish “Rule of the Majority” signal. Both the SPX and DJI making new post October 2022 rally highs implies higher U.S. stock prices – at least in the short – term.
The SPX high on 12/08/23 also invalidated a potential Fibonacci time cycle illustrated in the 11/26/23 blog “Time Cycle Turn Late November 2023” The bullseye target date was 11/20/23 with a leeway of two weeks. The time cycle was based on the SPX, the new SPX high on 12/08/23 is beyond the leeway zone.
