Within the last few weeks there’s been significant evidence the upward momentum of U.S. stock indices has been weakening. Going into mid-May there have been no bearish signals from the sentiment dimension. On May 18, 2023 there was a bearish sentiment signal that could be very important.
First an explanation of the differences between market momentum and sentiment. For stock markets, momentum can be divided into two parts, external and internal. External momentum is usually measured by price oscillators such as Stochastic or RSI. These types of indicators can measure if a stock or index is overbought/oversold. They can also signal potential trend changes when divergences occur.
Internal momentum indicators measure stock participation within an index, such as the advance/decline line and new highs/lows.
Sentiment indicators measure the opinions of market participants, they gauge fear/greed. Polling services such as Market Vane Inc. have a consensus number based on traders bullish/bearish opinions. Put/Call ratios are effective at catching stock markets bottoms, they are less effective at measuring stock market peaks.
The CBOE Volatility Index (VIX), which is based on Put and Call options can be very effective in catching S&P 500 (SPX) bottoms and tops.
The daily VIX and SPX chart courtesy of Trading View illustrates their relationship.

The VIX is sometimes called the “fear index” because it can spike sharply in deep and rapid stock market declines. The VIX is used primarily as a tool to discover stock market bottoms. Its probably not used or even known as a tool for catching stock market tops because VIX topping signals are subtle.
A sustained multi-month SPX rally should have a corresponding VIX decline. The VIX topping signal does not happen when its making a new low. The VIX topping signal comes when the SPX makes a new high with the VIX making a higher bottom.
Note that on 05/01/23 the SPX made a short-term high while the VIX made a new low in its decline from early March 2023. Then on 05/18/23 the SPX made a new post October 2022 rally high while the VIX held above its 05/01/23 bottom. On 05/19/23 the SPX moved a little higher, the VIX went a little lower yet still was above its 05/01/23 bottom.
The last VIX top signal was the small divergence in mid- August 2022. Prior to this occurrence there was a significant VIX topping signal from November 2021 to January 2022. Also note that within this time period there was a smaller VIX topping signal just before to a two-week SPX drop.
An SPX decline next week is needed to confirm at least a short – term VIX topping signal.
VIX topping signals do not occur very often. When this current signal is happening is very important.
The daily SPX chart illustrates effective lunar phase signals.
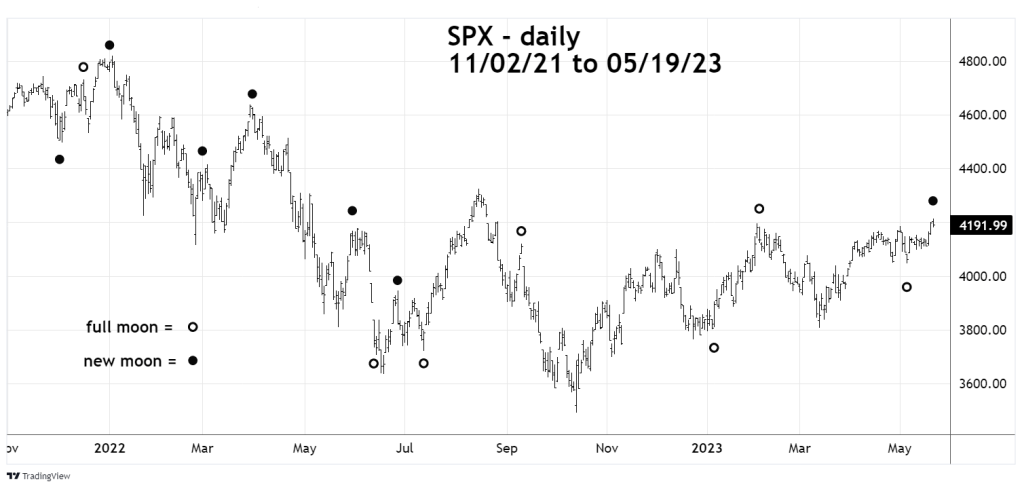
The 04/29/23 blog “Cycle Top Due on May 5, 2023” illustrated a Fibonacci time cycle that indicated an SPX turn on or near 05/05/23. The cycle length is 336 trading days, the largest gap between an SPX top and the target top was 5 – trading days. As of 05/19/23 it is 10 – trading days beyond the target date. Based upon the prior turns this wide gap implies the time cycle is no longer effective.
The seasonal bearish period for stock begins late April/early May, sometimes tops can occur later in May. The 05/20/15 SPX peak was the prelude to an 8 – month bear phase. If U.S. Stock were to continue rising into June 2023 it could imply something more bullish developing.
If a SPX top is made in May 2023 the lunar time cycle could be a factor.
The SPX chart illustrates effective lunar signals from late 2021 to 05/05/23. The leeway is 2 -trading days before or after a new/full moon. Note some of the lunar cycles illustrated came on the weekend. SPX tops tend to occur on or near a new moon. Of the 6 new moons 5 came on or near an SPX peak. Full moons usually indicate SPX bottoms. Of the 7 full moons, 4 were on or near an SPX bottom.
Also note that with the exception of the January 2023 full moon, all of the lunar signals came after a muti-day or sometimes multi-week spikes. Lunar signals are more likely to be effective on intense bullish/bearish emotion. The rally in U.S. stocks 05/16/23 to 05/19/23 could be an intense emotional spike.
For several weeks momentum for U.S. stocks has been bearish. Now there’s potentially bearish sentiment evidence. All of this is occurring in a seasonal topping period.
If U.S. stocks decline next week it could be beginning of a significant bear phase.
