Recently the S&P 500 (SPX) moved above its 05/01/23 peak and invalided one of several alternate Elliott wave counts. What has not been invalidated is the probability that the U.S. stock market could be on the verge of a multi-month decline. Elliott wave counts for the SPX and Dow Jones Industrial Average (DJI) provide clues as to what may be coming.
The SPX daily chart courtesy of Trading View updates its Elliott wave count.

There are two bearish alternate wave counts for SPX after its all-time high in January 2022.
The first alternate count has the January to October 2022 decline as an Elliott wave – Double Zigzag. The subsequent rally after October 2022 is also a Double Zigzag which may have ended on 05/19/23.
The second alternate count has the SPX forming an Elliott wave – Inverse Horizontal Triangle from its 06/16/22 bottom. Several recent blogs on this site have illustrated this wave count. The SPX 05/01/23 peak was the presumed Minor wave “E” of the Horizontal Triangle. When the SPX moved above the 05/01/23 top it invalidated the presumed Minor wave “E” alternate count, it did not invalidate the possibility that an Inverse Horizontal Triangle could still be forming from the SPX 06/16/22 bottom. In the updated wave count, the post October 2022 rally is Minor wave “C” of a developing Horizontal Triangle.
In both alternate counts the 05/19/23 peak could be the SPX- 2023 high. Both counts imply a multi-month decline could be imminent. Assuming there is a multi-month drop the differences between the two alternate counts could be a factor in determining the bottom of the multi-month decline.
For clarity, the labels for the presumed still developing Inverse Horizonal Triangle are not illustrated. The trendlines for the possible Inverse Horizontal Triangle are shown. The wave count showing the 05/19/23 peak as Intermediate wave (B) will be used as the prime SPX – Elliott wave count unless subsequent wave actions require a change.
The SPX 15 – minute chart reveals some fascinating clues.
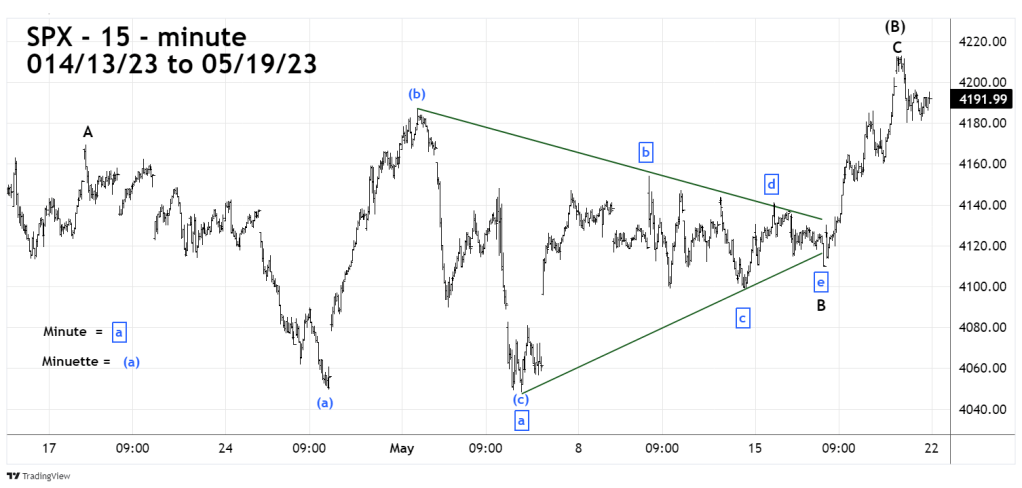
The SPX from 04/18/23 to 05/16/23 appears to have formed a Horizontal Triangle. Minute wave “a” of this structure sub divides into an Expanding Flat, which was first illustrated in the 05/06/23 blog “Expanding Flat Correction Complete – 05/04/23”.
After completion of a Horizontal Triangle there’s typically a post triangle trust in the direction of the main trend – which in this case was up. The rally after the SPX 05/16/23 bottom is nearly a textbook post triangle thrust.
The SPX 5 – minute chart examines the details of the rally.

The rally sub divided into a five – wave impulse pattern. Additionally Minute wave “ii” is almost .618 the size of Minute wave “iv” which is a typical Fibonacci relationship within impulse waves. Also Minute wave “i” is .382 of Minute wave “v”.
The 05/16/23 SPX bottom at 4,109.86 is important support, a break below this level could be very bearish.
The daily DJI chart from its all-time high has an amazing pattern.

From the DJI 02/24/22 bottom to its 05/01/23 top looks like a completed Inverse Horizontal Triangle. This pattern was illustrated in the 04/08/23 blog “Dow Jones Industrial Average – Elliott Wave Count – 04/06/23”.
The most fascinating aspect of the formation is the perfect trendline connecting the peaks of Minors wave “A”, “C” and “E”.
The Fibonacci relations among the sub waves are: Minor wave “A” is almost equal to Minor wave “D”. Minor wave “D” is close to .50 of Minor wave “B”. Minor wave “A” almost .50 of Minor wave “C”.
Drilling down to the DJI – 15 – minute chart reveals another fascinating structure.

It’s possible that after the DJI presumed Minor wave “E” top, the Inverse Horizontal Triangle may have extended into a rare nine -wave subdivision. If so the structure may have been completed at the 05/19/23 top.
If the DJI Inverse Horizontal Triangle is complete its correcting the downside DJI progress from its January 2022 top. At this time scale the main trend is down. Therefore, it’s likely the DJI could soon be in a post Inverse Horizontal Triangle – thrust down.
The next blog will examine evidence from the dimensions of time and sentiment.
