On 05/17/23 the Nasdaq Composite (IXIC) appeared to have an Elliott wave – Ending Diagonal Triangle (EDT) climax throw over. If this wave count was correct the throw over should have been completely retraced quickly. On this scale that means today. There was no retracement and IXIC went higher invalidating the EDT wave count.
Additionally, the S&P 500 (SPX) broke above its 02/02/23 peak and made a new post October 2022 rally high. This move invalidated the bearish “Rule of the majority” signal.
These two upside breakouts imply higher prices for U.S. stocks. How much higher could depend on the momentum for the indices.
The daily SPX chart courtesy of Trading View illustrates two external momentum indicators.

Both daily RSI and MACD have significant bearish divergences vs. the SPX 02/02/23 top.
The daily IXIC chart shows its external momentum indicators.
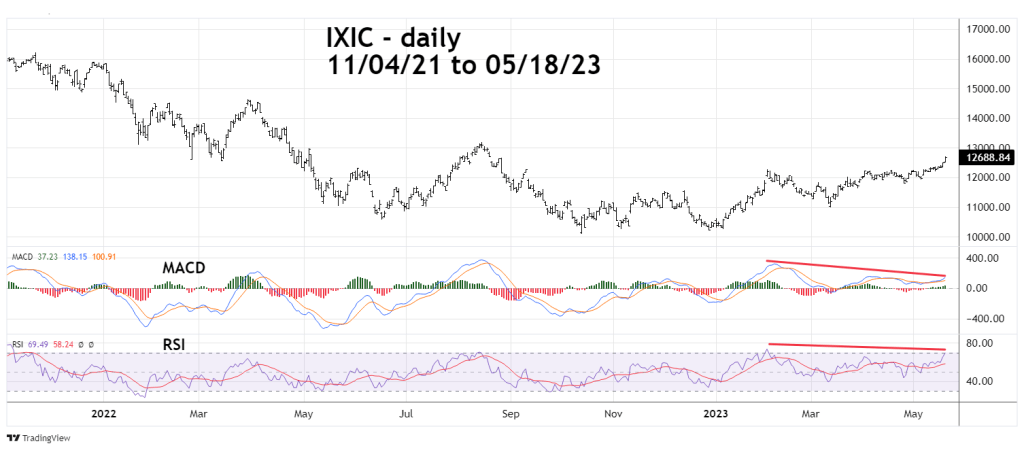
IXIC price is higher above its 02/2/23 peak than the SPX, yet it still has large MACD and RSI bearish divergences.
The 52 – week highs Nasdaq chart (MAHQ) courtesy of Barchart.com illustrates the Nasdaq internal momentum.
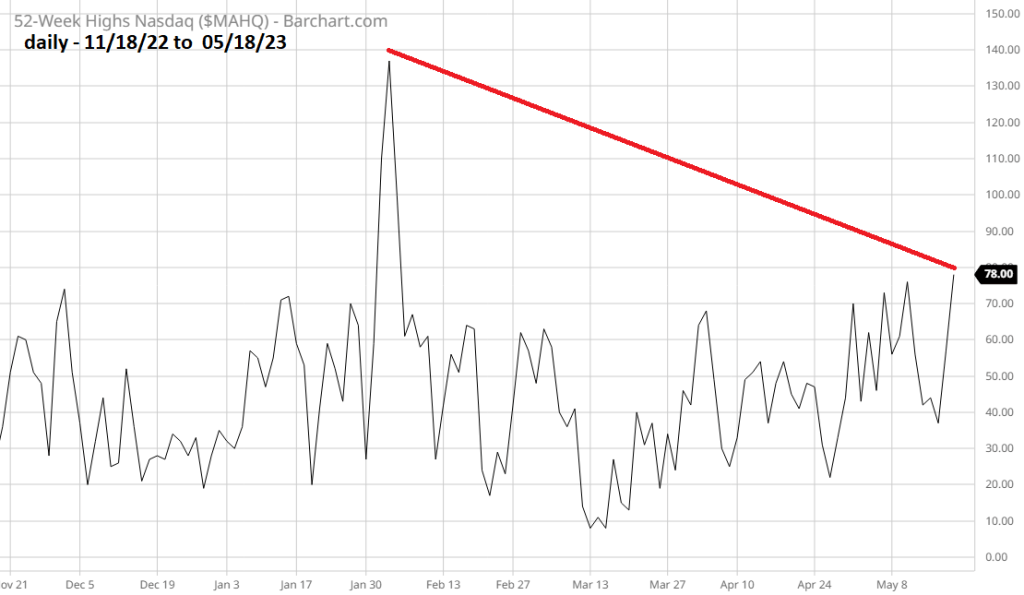
There’s still a huge bearish divergence relative to the IXIC peak on 02/02/23.
The next chart shows the NYSE – 52- week highs ($MAHN).

Not only are 52 – week highs diverging on the 02/02/23 SPX top, there’s also a bearish divergence vs. the SPX 05/01/23 peak.
The significant SPX and IXIC external and internal bearish momentum divergences are not what you would expect in a sustained bullish move.
An important top for U.S. stocks could be made in the next few trading days.
At the SPX 05/17/23 open traders entered a 50% position on non – leveraged SPX inverse funds with a stop loss for half of the position on a move above the SPX 05/01/23 top. The percentage move from the entry point was 1.6% a loss of .80% on half of the position. Continue to hold the other half position using a move above SPX 4,300.00 as a stop loss point.
The SPX rally from its 05/16/23 bottom could be a buying panic. The next blog will examine the SPX – Elliott wave structure.
