Today 05/16/23 the Nasdaq Composite (IXIC) was the only one of the three main U.S. Stock indices to exceed its 05/15/23 high. Throughout the day there were more Nasdaq stocks declining than advancing.
The 15 – minute IXIC chart courtesy of Trading View updates the Elliott wave count.
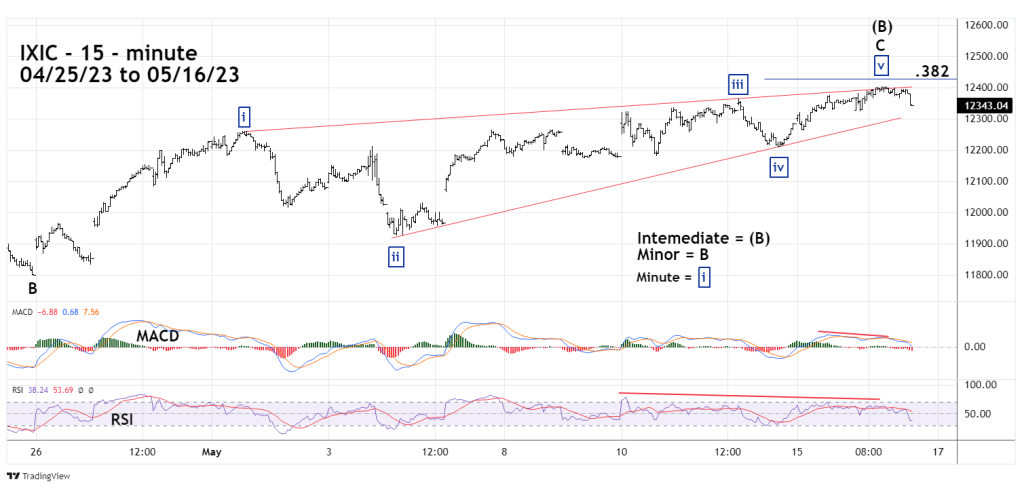
The Elliott wave – Ending Diagonal Triangle that began at the IXIC 04/25/23 bottom appears to have completed at today’s high of 12,403.01. Major Fibonacci resistance which is a .382 retracement of the IXIX November 2021 top to October 2022 bottom is at 12,427.97. Today’s high was only 24.96 points from the target or 24.96/12,427.97 a difference of .002.
Also note the significant bearish divergences on the RSI and MACD.
When making downside bets on stocks or stock indices avoid the stronger stocks or indices. In this case there could be greater profits by making downside trades on either the currently weaker S&P 500 (SPX) or Dow Jones Industrial Average.
For simplicity this website will focus on the SPX.
At the open of the SPX session on 05/17/23 establish a 50% position on SPX – non leveraged inverse Exchange Traded Funds. Use a move above the SPX 05/01/23 high as a stop loss for half of the position.
Add on to the inverse fund position if the SPX moves below its 05/04/23 bottom.
