The 04/23/23 blog “UK 100 at Sell Point? – 04/21/23” noted the UK 100 (UKX) had reached an area of chart resistance. Since then, the peak at 7,936 has held.
The daily UKX chart courtesy of Trading View updates the action.
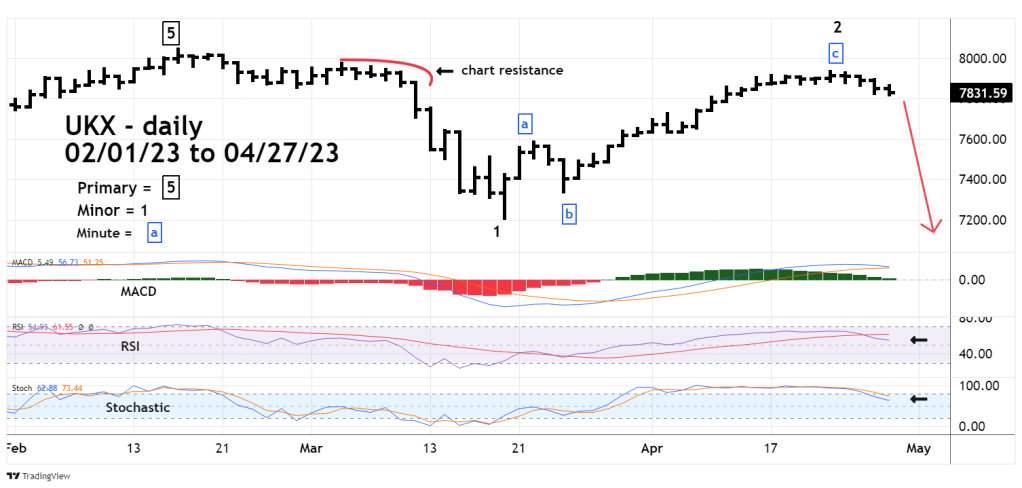
Price has begun to rollover. The daily RSI has crossed below it’s moving average line. Daily Stochastic has a bearish lines cross. Daily MACD is on the verge of a bearish lines cross.
The UKX could reach the 03/20/23 bottom by mid or late May 2023.
It’s possible the UKX is leading a worldwide stock market decline.
