The 04/02/23 blog “Britannia Rules the Elliott Waves” noted that if the UK 100 (UKX) exceeded a .618 retracement of the 02/16/23 to 03/20/23 decline – the next resistance was at 7,850 to 7,975.
The 3-hour UKX chart courtesy of Trading View updates the action.

The UKX has reached the resistance zone and a small rally could complete the Minor wave “2” formation.
The 15-minute UKX – Point & Figure chart gives greater clarity to the potential resistance zone.
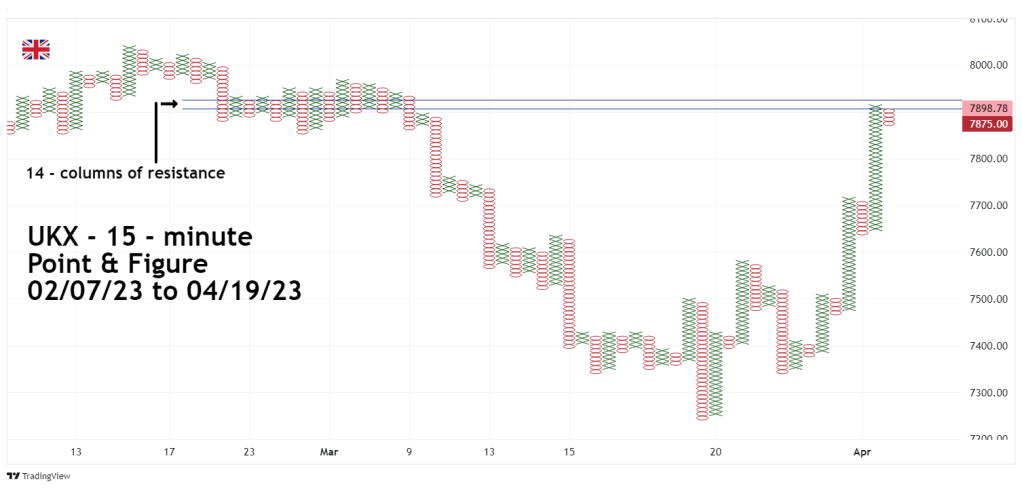
The greater the number of columns, the greater the potential support/ resistance. 14 – columns represent powerful resistance.
The UKX could complete the pattern on 04/20/23. If a top is made, the next decline could last for several weeks – perhaps months.
