The U.S. CPI report is due out at 8:30 AM – EDT – 04/12/23. It’s possible this report could trigger an important turn for U.S. stocks.
The 30 – minute S&P 500 (SPX) chart courtesy of Trading View updates the action.
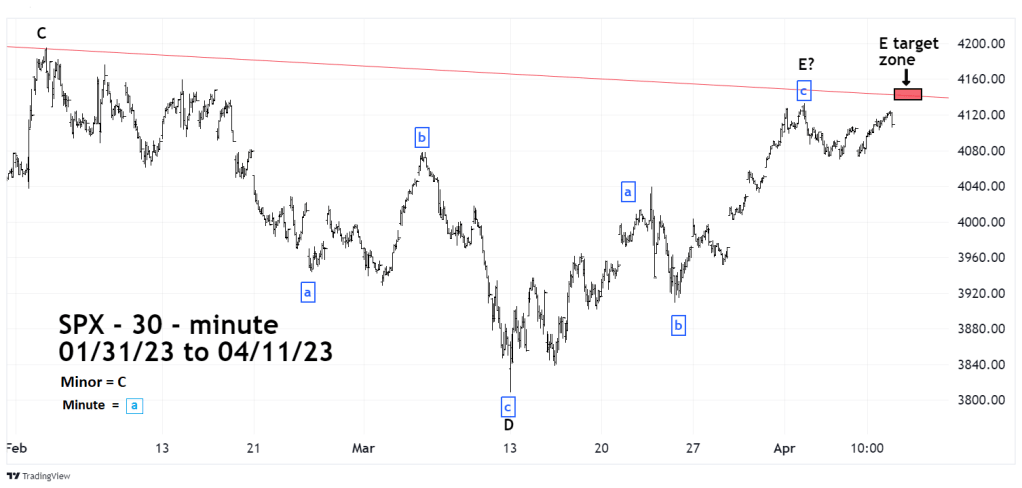
If the report triggers a rally it may not last very long. Just above the SPX 04/04/23 high is a multi- month declining trendline which has been illustrated in prior blogs on this site. If the SPX can reach this zone it could be the beginning of at least a multi- week decline.
Note it’s possible the presumed Inverse Horizontal Triangle – Minor wave “E” may have completed on the 04/04/23 top. If the SPX declines immediately after its open 9:30 AM – EDT and continues to drop throughout the session then the Horizontal Triangle is probably complete at the 04/04/23 top.
I will have an SPX blog update after the trading session concludes 4:00 PM – EDT – 04/12/23.
Also, at 11:00 PM – PDT – 04/12/23 I will have a Zoom talk about the global stock market with the “Society of Technical Analysts” who are in the Philippines. The talk will be at 2:00 PM – PHST – 04/13/23 – Philippines time.
