How much lower could U.S. stocks go before reaching an important bottom?
Momentum oscillators are similar to a fuel gauge for markets, they can give you a rough estimate of where a movement could end.
The weekly S&P 500 (SPX) chart courtesy of BigCharts.com illustrates the action since early 2022.
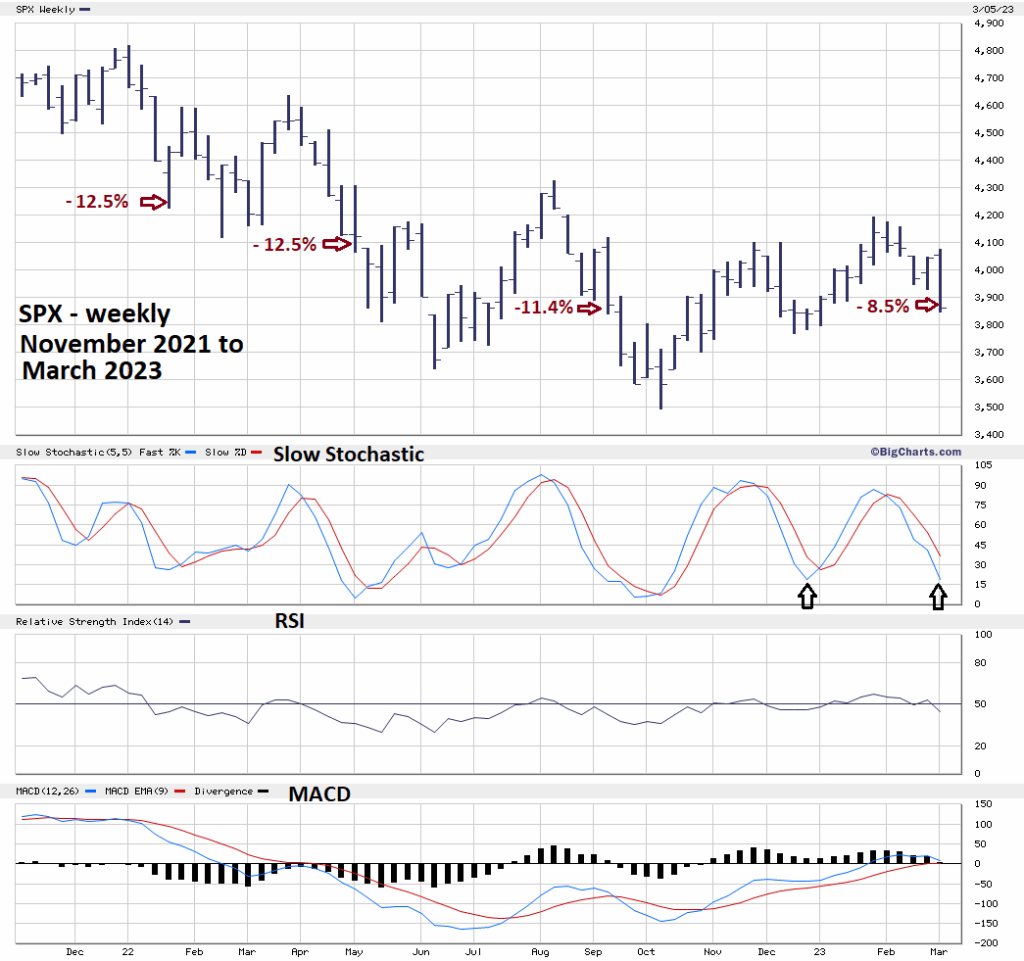
Stochastic is generally a more sensitive oscillator making it effective in judging when a market movement could terminate. As of 03/10/23 the lower Slow Stochastic line has reached the oversold zone – below 20%. The upper line is still in the neutral zone. This implies there’s still enough fuel for the SPX to go lower. However, note that both lines are at about the same level as when the SPX bottomed in December 2022.
Another interesting aspect is the speed of the recent SPX decline. The drop of 8.5% from the January 2023 top has lasted five – weeks. Now compare this decline to the initial move down from the three peaks made in 2022. The first drop off of the January 2022 top is particularly interesting because it fell 12.5% in only four weeks. Faster and further than the current decline. Five weeks after the March 2022 top the SPX dropped 12.5%. Five weeks after the August 2022 peak the SPX was down 11.4%. So far the SPX – 2023 bear move is weaker than the three initial bear moves in 2022.
Sentiment indicators can sometimes be used as market fuel gauges. The daily Put/Call (PC) and VIX chart courtesy of Trading View illustrate current sentiment for U.S. stocks.
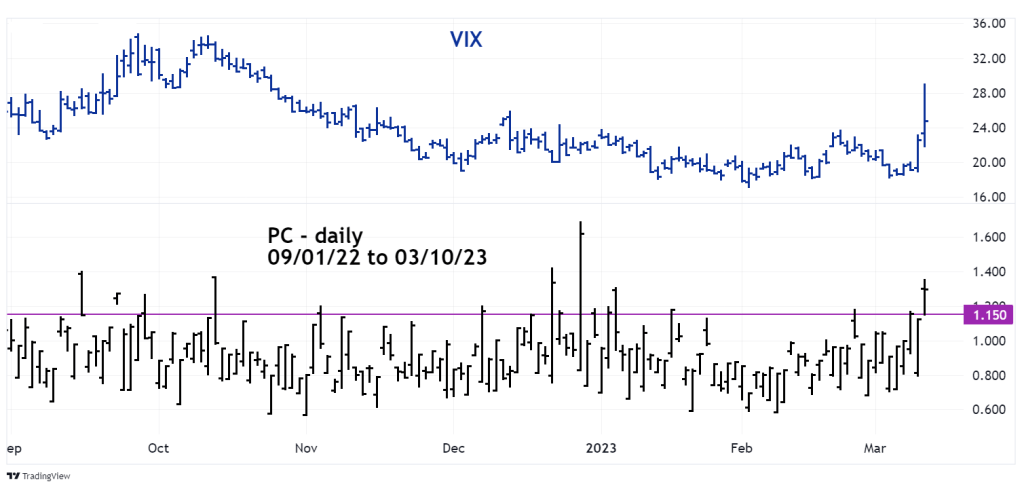
The PC on 03/10/23 moved significantly above the 1.15 level yet is still below the PC tops made in 2022. VIX also moved significantly higher and has room for more upside. The message from both sentiment indicators implies U.S. stocks at least in the near term could go lower.
The daily Dow Jones Industrial Average (DJI) chart updates the Elliott wave count for this index.
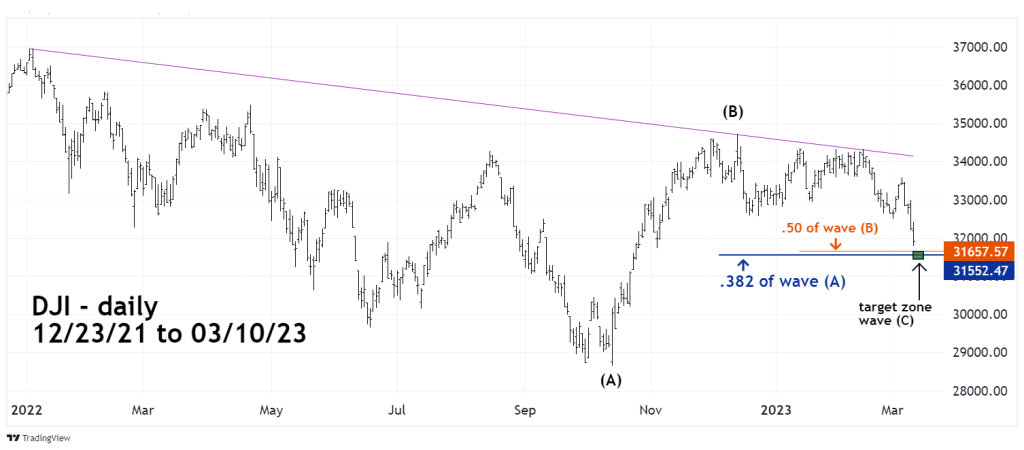
Several blogs on this site have noted that the DJI could be forming an Elliott wave – Horizontal Triangle from its January 2022 peak. This is still a high probable wave count with the decline from the December 2022 top as a developing wave ( C ). If so the current decline could terminate in the area of two Fibonacci coordinates.
The primary Fibonacci coordinate is near 31,552 which is where the presumed wave ( C ) would be .382 of the length of wave ( A ).
The secondary Fibonacci coordinate is near 31.657 which is a .50 retracement of the DJI – October to December rally.
The DJI – Horizontal Triangle is valid unless the presumed wave ( C ) goes below wave ( A ).
Important. A possible scenario could have the DJI make a bottom sometime next week, then rally for a few weeks – holding below the December 2022 high, before starting a new decline. The new decline could continue for weeks or months – maybe down to 30,000? The presumed wave ( A ) lasted for nine months, wave ( C ) could last for eight months and terminate in August 2023. Sometimes Horizontal Triangles can meander and stretch out. We need to be prepared for a possible choppy down move.
The 30 – minute S&P 500 (SPX) – Point & Figure chart illustrates a potential support zone.
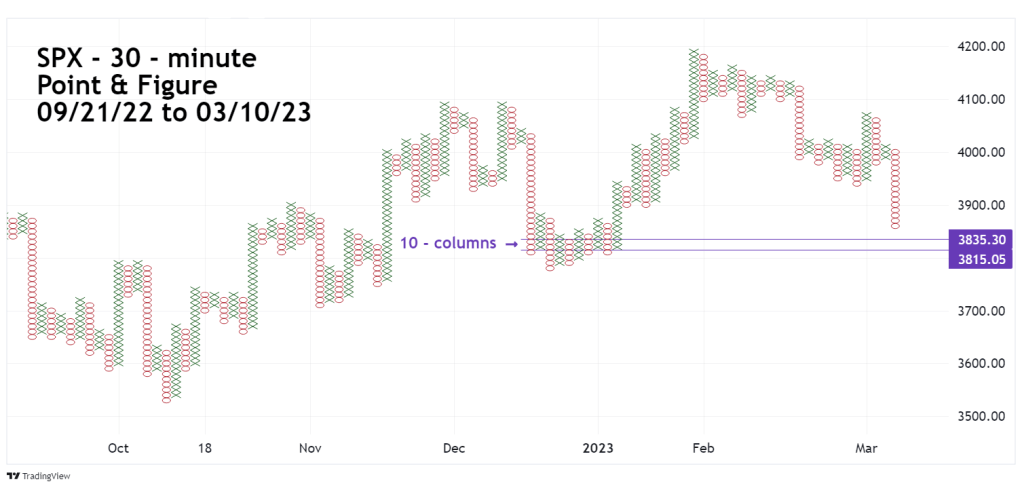
Point & Figure charts are very good at discovering potential support/resistance zones. The greater the number of columns the greater the potential support/resistance.
The SPX could find support in the low 3,800’s area where there are 10 – Point & Figure columns.
The book “Mind Over Markets” which explains the “Market Profile” method has a very interesting quote.
“Which way is a market trying to go?” and “Is it doing a good job in its attempt to go that way?”
From the bullish side the U.S. stock rally since October 2022 has been slow and difficult to sustain. On the bear side the decline since the SPX February 2023 top has been relatively weaker than drops in 2022.
Seasonal stock patterns are bullish until late April/early May. Its possible the DJI could make a new all-time high into that time. Or the DJI could fail to make a new high in April/May, instead grind lower for several months. Seasonality favors the bulls, however that time zone is shrinking.
