The blog “Move Up From Important Support – 03/02/23” noted the S&P 500 (SPX) rallied after it reached the area of two Fibonacci support levels and the 200 – day moving average (MA). Today 03/09/23 the SPX broke and closed the session below this important support. This break opens the door for more downside action.
The daily SPX chart courtesy of BigCharts.com shows what happened.
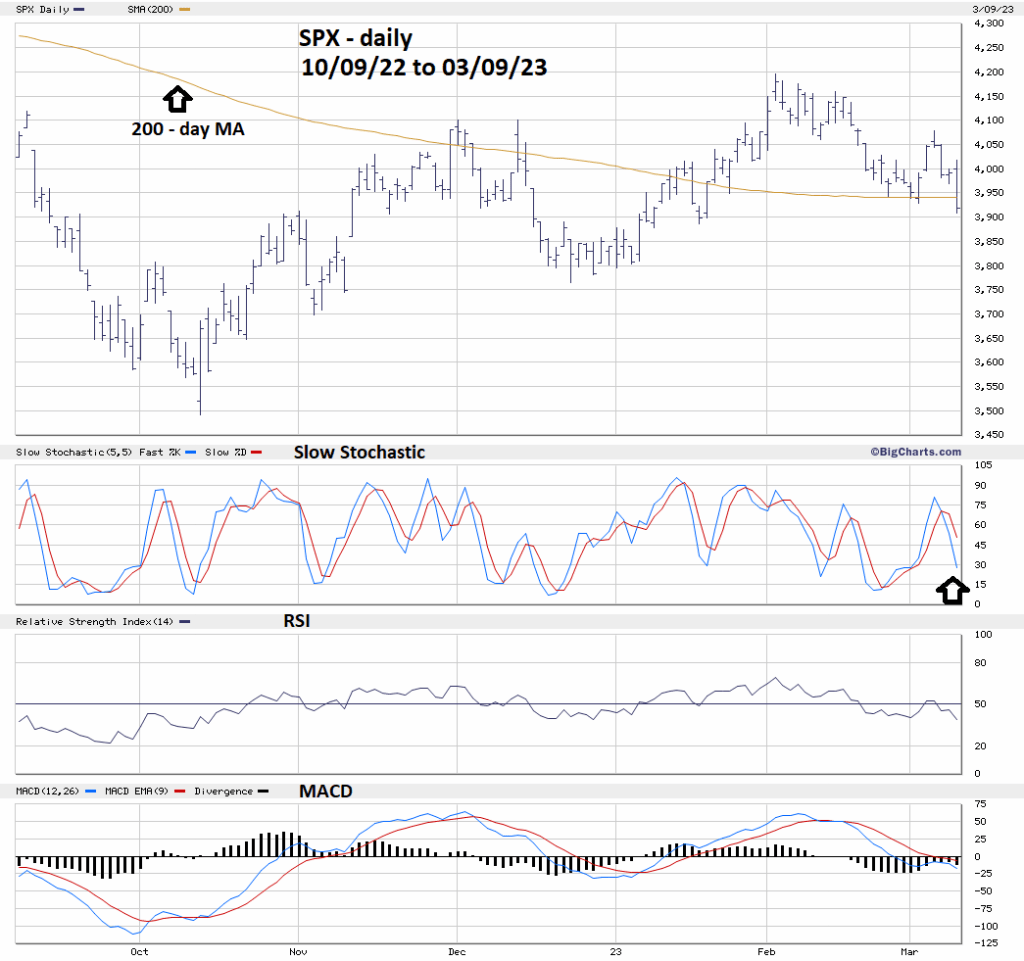
The BigCharts.com Slow Stochastic is a very effective indicator. Both lines are above 20% which is the border of its neutral zone. It appears Slow Stochastic could continue lower for at least a few days along with price.
Daily RSI had no bullish divergence and is also still in its neutral zone – above 30%.
Daily MACD has a bullish divergence on the Histogram.
The balance of evidence from the momentum indicator is bearish.
The next chart courtesy of Trading View updates the relationship between the SPX and the Put/Call ratio (PC).
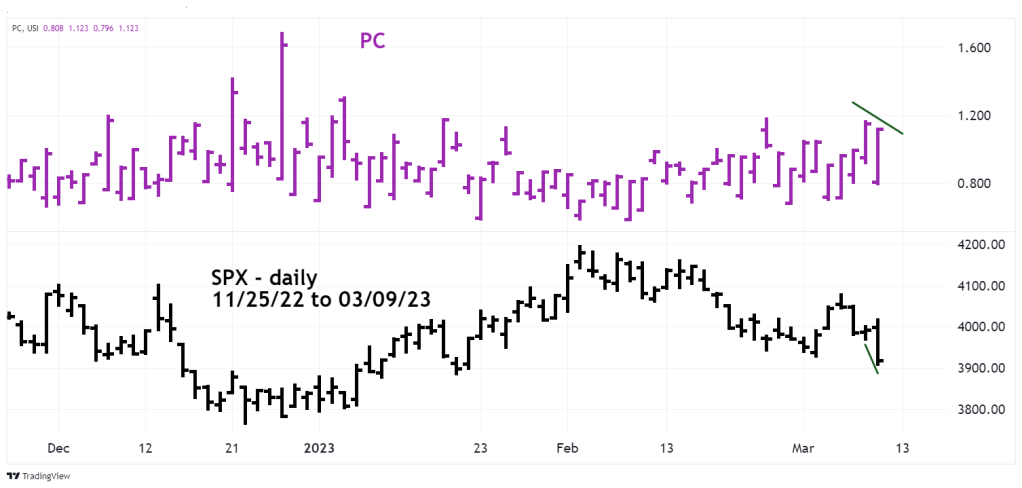
The 03/08/23 blog illustrated that PC had moved above the 1.15 level which usually indicates the SPX could be near or at a bottom.
Today 03/09/23 PC never went above the 1.15 level and closed the session lower than its 03/08/23 close with the SPX at lower prices. This could mean that fear is subsiding – a bullish sentiment divergence. However, if there’s more fear PC could move a lot higher.
The U.S monthly employment report is due to be released 8:30 AM – ET – 09/10/23. The reaction of stocks to this report could affect their direction for at least several days, possibly longer.
