The most recognized line in the British patriotic song “Rule, Britannia!” is “Rule Britannia, Britannia rule the waves.” On 02/03/23 the British stock market – UK 100 index (UKX) was the first major national stock index to make a new all-time high. Perhaps UKX is ruling the Elliott waves.
The move above the prior all-time high made in May 2018 is significant because it clarifies where the UKX could be in the Elliott wave cycle. Also, the breakthrough supports the theory that at least one main U.S stock index could soon make a new all-time high – most likely the Dow Jones Industrial Average.
The monthly UKX chart courtesy of Trading View illustrates the long-term Elliott wave count.
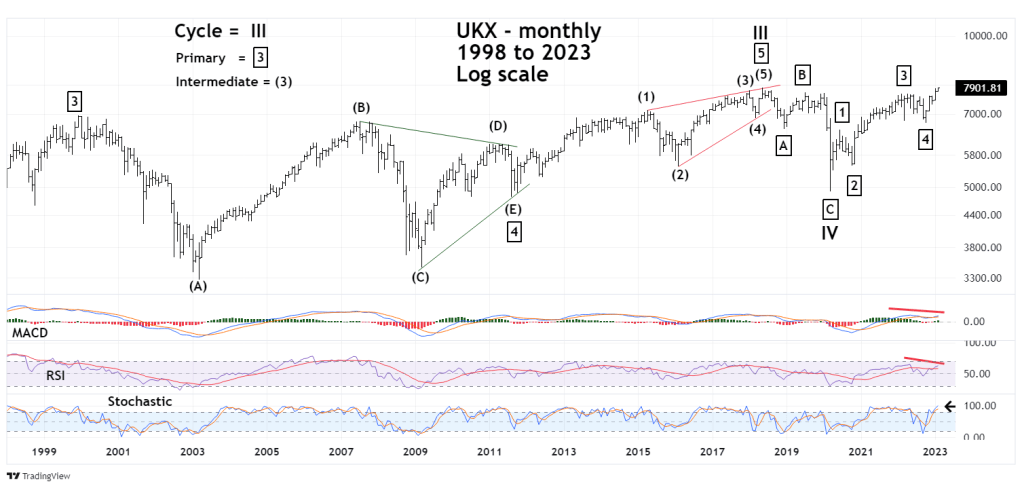
Following the major peak made in December 1999 the UKX went into a multi-year Elliott wave – Horizontal Triangle that terminated in August of 2011. Normally after a Horizontal Triangle there’s a thrust in the direction of the primary trend – in this case up. However, what formed was an Elliott wave Ending Diagonal Triangle. This pattern occurs in the fifth wave position of Elliott motive waves.
The combination of a Horizontal Triangle followed by an Ending Diagonal Triangle created an overall choppy pattern which opened up the possibility for several alternate counts. From about 2007 to 2018 Elliott wave analysis was difficult.
The situation changed after the 2018 top. The subsequent decline into the 2020 bottom was a clear three wave corrective pattern. Then a five-wave rally.
Also note that the monthly MACD and RSI currently have bearish divergences.
The rally illustrated in the weekly UKX chart is also very clear.
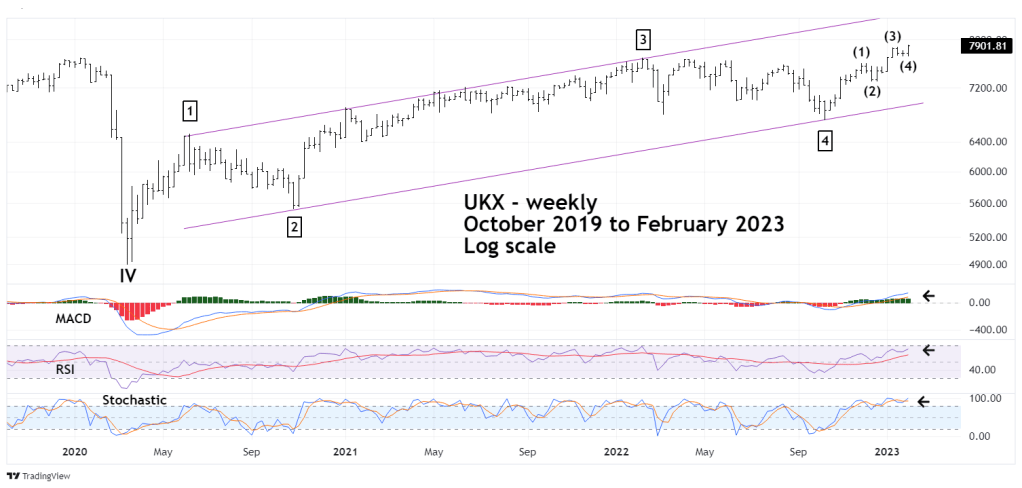
This chart was first shown in the 01/08/23 blog “UK 100 Upside Breakthrough” the trendlines were made using the Trading View parallel channel drawing tool. All four of the Elliott wave termination points fit perfectly in the parallel channel.
So far the weekly RSI and MACD are not showing any bearish divergences, which implies more upside action.
The daily UKX chart focuses on the short-term Elliott wave count.
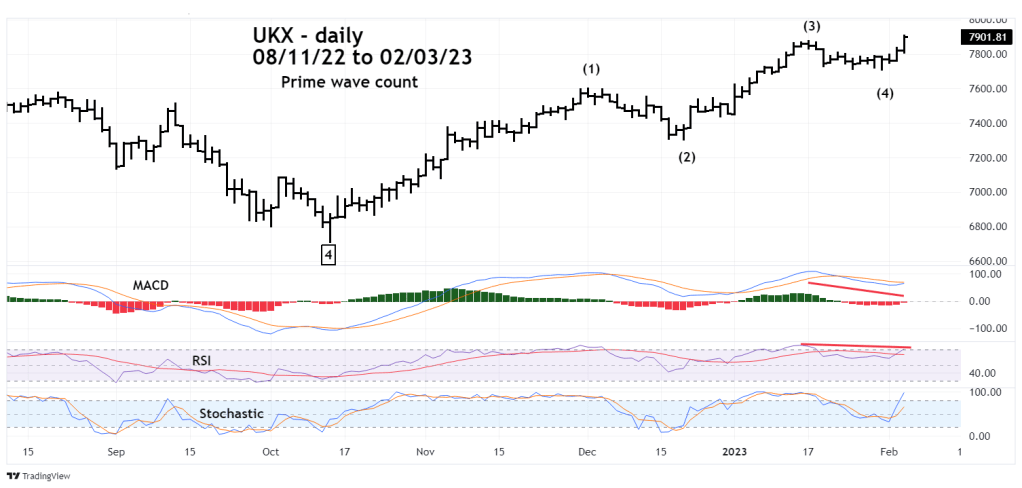
This is the prime wave count because it matches the weekly UKX count off of the October 2022 bottom. Note that the daily MACD and RSI have bearish divergences, however this conflicts with the weekly MACD and RSI that have no divergences.
There’s an alternate wave count illustrated in the next daily UKX chart.
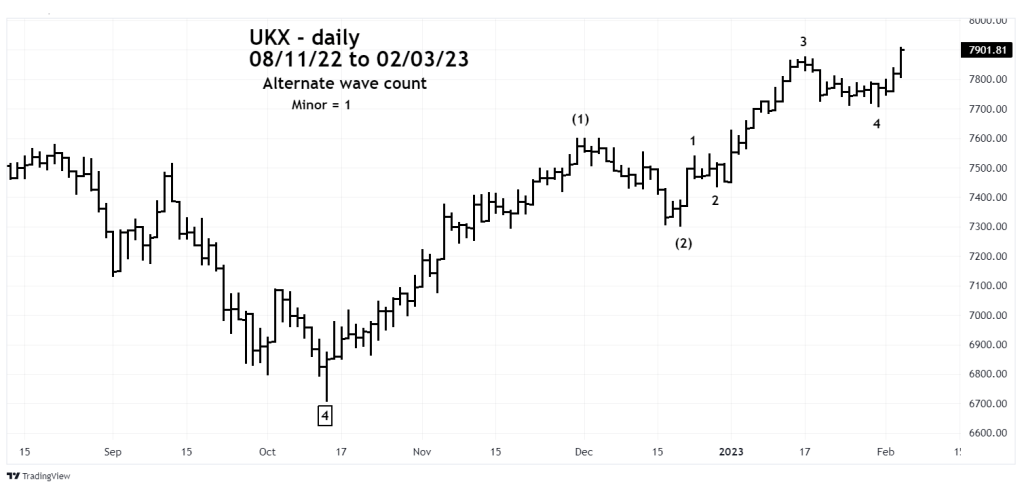
In this count Intermediate wave (3) is still under development. This wave count also ties in with upside targets made in the 01/08/23 blog. The projection was made for the third wave up from the October 2022 bottom. The two targets were 8,180 and 8,260.
In the next few weeks we could have an answer as to which short-term wave count is correct.
Elliott wave theory is like a road map showing an analysist where a market could be at various cycle phases. On the long-term cycle the UKX move above its May 2018 top indicates that a multi-decade bull market could be in its final stage.
The movement up from the March 2020 bottom also appears to be nearing a termination point.
The rally up from the October 2022 low could either be in the mid or late stage.
There’s a high probability of a major UKX and global stock market top occurring sometime in 2023. The UKX could be very important in identifying when that peak occurs.
The UK 100 index is a must watch indicator for traders/investors worldwide!
