Today the S&P 500 (SPX) 50 – day moving average (MA) line moved above the SPX 200 – day MA line which is called a “Golden Cross”. Prior to today’s event this has happened only eleven times since December 1998, about one signal every two years.
The daily SPX chart courtesy of Trading View puts the signal in proper perspective.
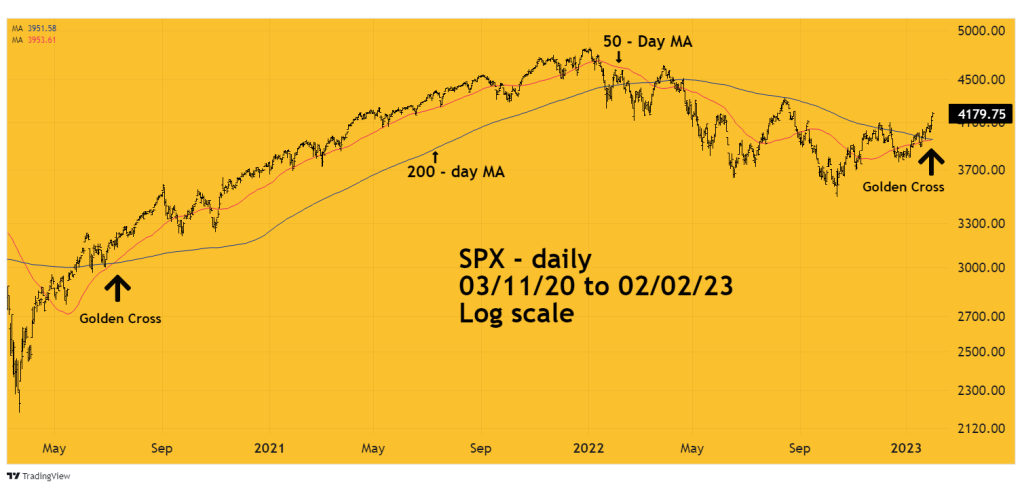
The previous signal was the beginning of a seventeen month bull phase into the major peak made on 01/04/22.
The shortest rally after the “Golden Cross” happened in December 2015. Five trading days after the signal the SPX closed below both its 50 – day and 200 – day lines, the beginning of a one-month decline. If the SPX were to close below the MA lines in the next few trading days, it may also indicate a new down trend.
The next longest post “Golden Cross” rally was three months. This fits in with bullish seasonal patterns which lasts until late April/early May.
Of the other nine Golden Crosses the shortest post cross bull phase lasted three – months.
The current rising interest rate environment in the U.S economy favors a potential stock rally top in April/May 2023.
Probability analysis of the prior eleven “Golden Cross” signals hints U.S stocks could rally beyond May 2023.

Thank you for your daily view of the market trends and sentiment. I especially appreciate the varied modes of analysis such as the relative importance of the Singapore, London and Mexican exchanges.
The Golden Cross is the indicator I’ve been waiting on, glad to see your views on it this morning.
LikeLike
Hi Michael
I’m glad I can help.
Mark
LikeLike