Today from the perspective of Fundamental analysis the big news for U.S stocks was – FOMC raises short – term interest rates by .25%. There was also big news for U.S stocks from the perspective of Technical analysis.
Bullish evidence for U.S stocks has been developing since early October 2022.
This sites 10/08/22 blog “Russell 2000 – Bullish Signal’’ illustrated that the Russell 2000 (RUT) had stronger upside performance relative to the S&P 500 (SPX). The RUT is composed of small cap stocks and noted in the blog, “If the bear market has resumed you would expect the small cap stock index to be leading the way down. Smaller companies are much more sensitive to economic weakness than larger companies.”
The 10/13/22 blog “Dramatic Reversal – 10/13/22” noted that the drop in U.S stocks on the CPI report could have been a selling climax. Also illustrated was bullish evidence from the SPX – daily – Stochastic, RSI and MACD momentum oscillators.
The 10/16/22 blog “Momentum and Sentiment Update – 10/14/22” illustrated bullish sentiment and momentum evidence.
The 10/19/22 blog US Interest Rates Could be Near a Top. Noted that a drop in U.S interest rates could be a catalyst for U.S stocks to rally. Rates for 30 – year U.S Treasury Bond topped on 10/24/22.
The 12/28/22 blog “Curious Sentiment Spike – Part Two” noted the Put/Call ratio had its biggest spike in two – years and that the SPX could rally 15 to 20% into late January 2023. The SPX rallied 8% into late January 2023.
The 12/31/22 blog “Bear Panic Point” noted that an SPX move above its 200 – day moving average (MA) and declining trendline could trigger a rally to SPX 4,400. Subsequently the SPX moved above the Bear Panic Point.
The 01/14/23 blog “Rare Bullish Momentum Signal” illustrated that the NYSE advanced/decline line for only the fifth time in fourteen years had moved above its 50 – week Simple Moving Average line.
The daily SPX chart courtesy of Trading View illustrates additional bullish evidence.
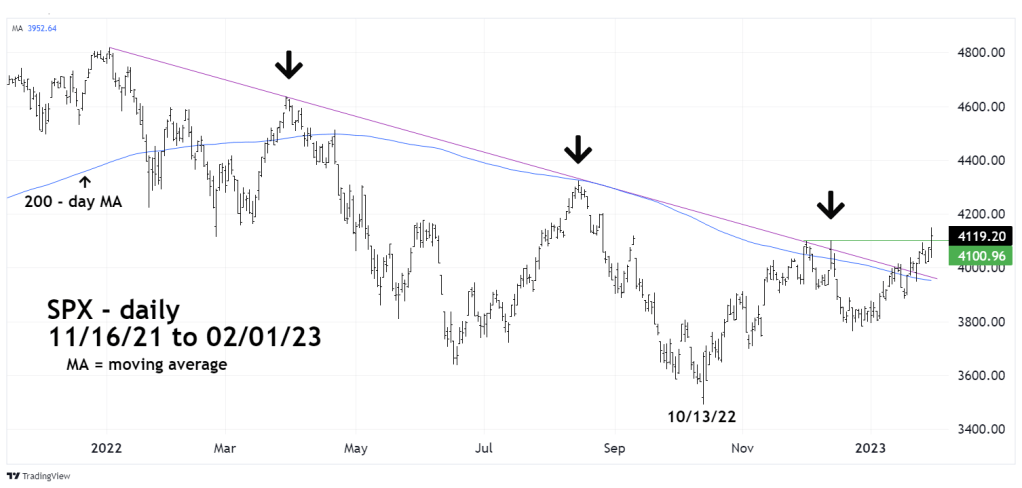
The big news from the perspective of Technical analysis is that the SPX has moved and closed above its 12/13/22 top.
The basic definition of a bear market is a series of lower lows and lower highs. Today’s action reinforces evidence from the 200 – day MA and the declining trendline breakout.
Even more bullish evidence could be coming soon. Watch the SPX – 200 – day and 50 – day MA.
