The S&P 500 (SPX) 50 – day moving average (MA) is close to crossing above the SPX 200 – day MA. This is called a Golden Cross. Since 1998 there have been eleven Golden Cross signals that could provide insight into the coming months.
The daily SPX chart courtesy of Trading View illustrates its 200 – day and 50 – day MA.
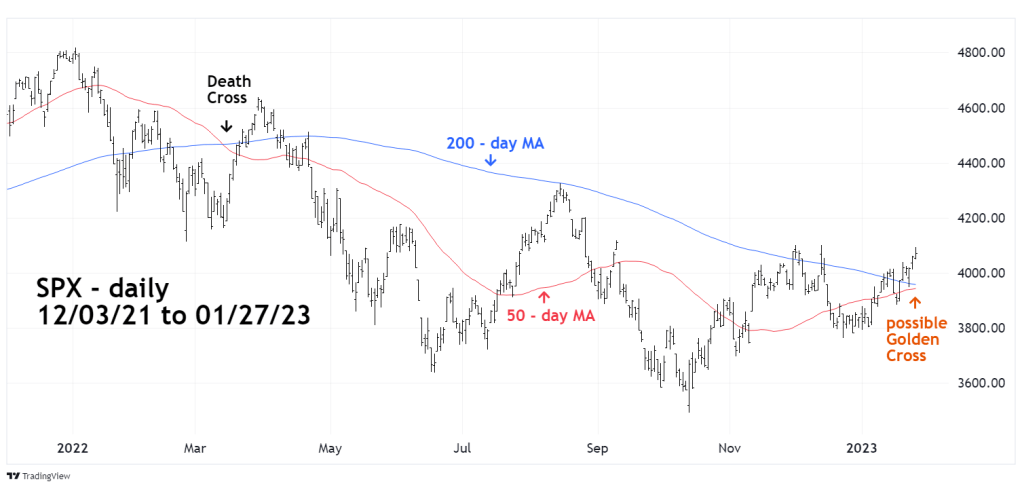
Stock markets generally rises at a slow and steady pace, therefore Golden Crosses typically signal bull moves that can continue for several months or even years.
When the 50 – day MA moves below the 200 – day MA its called a Death Cross. Because stock markets usually decline faster than they rise, Death Cross signal bear moves of weeks and possibly months. Some Death Cross signals will occur after a market has bottomed. Note the most recent Death Cross signal on 03/14/22. While this signal was effective in forecasting what turned out to be a seven-month bear phase, the day of the signal was a near term bottom.
The following are the SPX – Golden Cross signals since December 1998. Eight of the signals had bull moves that peaked before at least a 10% decline and a Death Cross.
07/09/20 to 01/04/22 – length 17 – months.
04/01/19 to 02/19/20 – length 10 – months.
04/22/16 to 01/26/18 – length 21- months.
12/22/15 to 12/29/15 – length 1- week.
{02/01/12 to 04/12/12 – length 3- months, decline of 10.9% with no Death Cross. After the decline the bull move lasted until 05/20/15 a total length of 38 – months from 02/01/12 signal.}
10/22/10 to 05/02/22 – length 6- months.
06/23/09 to 04/10/10 – length 9- months.
09/12/06 to 07/16/07 – length 10 – months.
{11/05/04 to 05/18/06 – length 17 – months, decline of 8% with a Death Cross.}
{05/14/03 to 03/14/04 – length 9- months, decline of 8.75% with a Death Cross.}
12/08/98 to 07/19/99 length 8 – months.
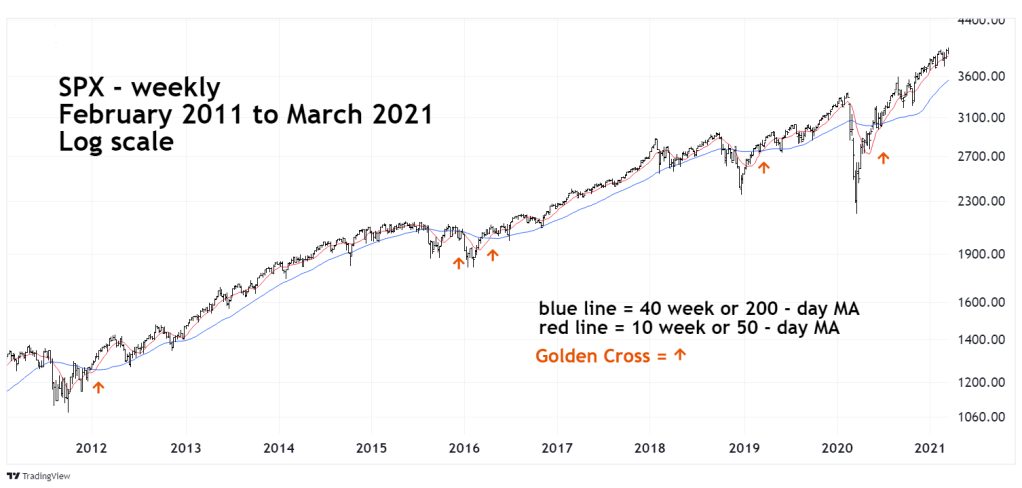
The weekly SPX chart from February 2011 to March 2021 shows the Golden Cross signals using a 40 – week MA to approximate the 200 – day MA and the 10 – week MA to approximate the 50 – day MA.
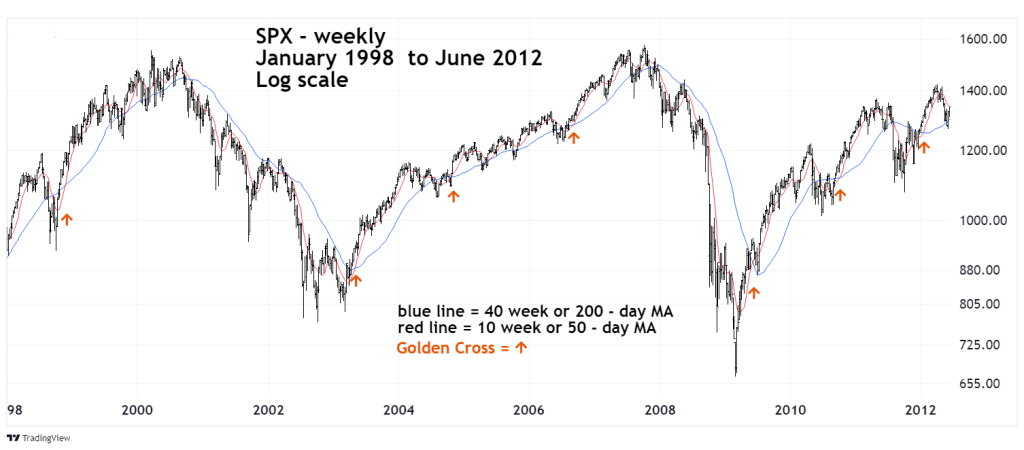
The next weekly SPX chart illustrates the Golden Cross signals from 1998 to 2012.
Seasonal Stock patterns are bullish until late April/early May, about another three months. If there’s a Golden Cross signal in the next few trading days, data from prior crosses alerts us that U.S stocks could continue to rise beyond May 2023.
