Of the twelve SPDR Sector Select ETF’s the most bullish is the Energy sector fund (XLE). From the first trading day of 2022 – 01/03/22 to 01/27/23 the S&P 500 (SPX) is down 14.4%. The XLE over the same time is up 65.4%. Assuming the current uptrend in U.S stocks continues, XLE is likely to lead the way up. Elliott wave analysis provides clues as to where the XLE bull trend may terminate.
The weekly XLE chart courtesy of Trading View shows the long-term perspective.
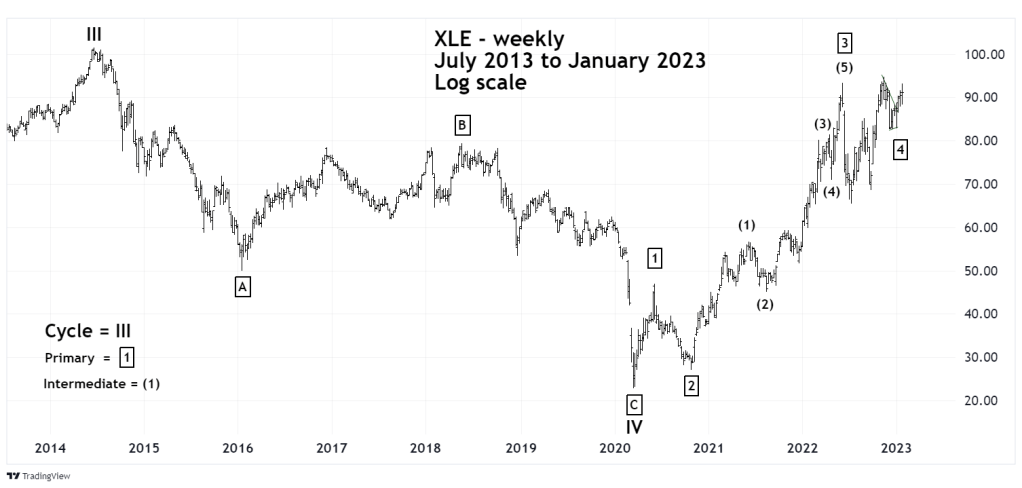
After its all-time high in June 2014 the XLE was in a colossal six- year bear market and underperformed the SPX by a wide margin.
Beginning in March 2020 XLE has been in what appears to be a Cycle degree Elliott impulse pattern.
The daily XLE chart illustrates that an Elliott wave corrective pattern may have ended on 01/04/23.
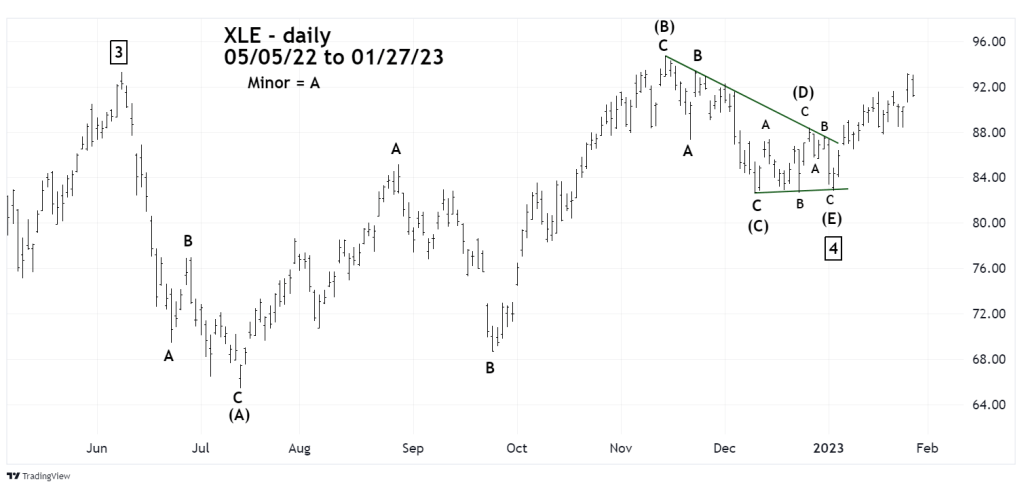
An Elliott wave – Horizontal Triangle that began at the XLE top 06/08/22 may have completed on 01/04/23.
Horizontal Triangles are corrective patterns to the main trend, which in this case is up. They only appear in the fourth wave positions of Elliott motive patterns and in the “B” wave position of (A,B,C) corrections. Horizontal Triangles divide into five sub waves each of which divide into three wave structures. The presumed XLE – Horizontal Triangle is called a Running Triangle, in which wave “B” moves marginally beyond the wave “A” point of origin.
There are several Fibonacci relationships within this Horizontal Triangle.
Waves (A) and (B) are close to equal.
Waves (D) and (E) are close to equal.
Wave (C) is close to 38% of wave (B).
After completion of a Horizontal Triangle there’s usually a thrust in the direction of the main trend.
The thrust typically is measured by the widest part of the Horizontal Triangle.
In this case the widest part begins at the bottom of 64.48 made on 07/14/22, to the top on 11/14/22 at 94.71 and is 29.23 points. Adding 29.23 to the termination point of the Horizontal Triangle which is the wave (E) bottom of 82.83 targets at peak at 112.06.
Another way to calculate the move up after wave (E) is the growth percentage of July to November of 44.4%. Adding this growth rate to 82.83 targets a top at 119.60.
The vast majority of the time fifth waves exceed the termination point of third waves. The presumed Cycle wave “III” XLE top was at 101.52. If the XLE rally after March 2020 is Cycle wave “V” – then the target range of 112.06 to 119.60 is about what could be expected when wave “five” exceeds wave “three”.
