Some time in the next few months a major national stock index could be completing an Elliott wave pattern that began in October 2008.
One of the most fascinating discoveries that R.N Elliott made about wave theory is that form remains constant regardless of size. A wave pattern of five – hours could have the same form as a pattern lasting five days, five years, or longer.
The Shanghai Stock Exchange Composite (SSE) could be in the final stage of an Elliott wave – Horizontal Triangle that began in October of 2008.
First we need to examine the SSE in relation to major S&P 500 (SPX) turns.
The monthly SSE and SPX chart courtesy of Trading View illustrates the comparison. Note – the Trading View symbol for the Shanghai Stock Exchange Composite is (000001). For the sake of clarity this blog is using SSE to represent the Shanghai Stock Exchange.

There are only two significant discrepancies between SPX and SSE turns. The first occurred in October 2008. In that instance SSE bottomed almost six – months before the SPX bottom in March of 2009.
The second occurrence was in 2021 when the SSE had three declining tops while the SPX continued to rise. The final SSE 2021 top was one month before the SPX January 2022 peak. All of the other SSE tops or bottoms happened within one month of an important SPX turn.
The weekly SSE chart shows the Elliott wave – Horizontal Triangle that could be forming after the October 2008 bottom .

Horizontal Triangles are sideways corrective patterns to the main trend, which in this case is down. They are composed of five sub waves, each of which further subdivide into three waves or a combination of three waves patterns. After the Horizontal Triangle is complete there’s usually a thrust in the direction of the primary trend.
It appears that the presumed Horizontal Triangle is now in the final sub wave – Primary – “E” – boxed . If so Primary wave “E” could peak somewhere near the declining trendline, possibly in the next two or three months.
The monthly SSE chart shows what could happen if the Horizontal Triangle terminates in the target zone.
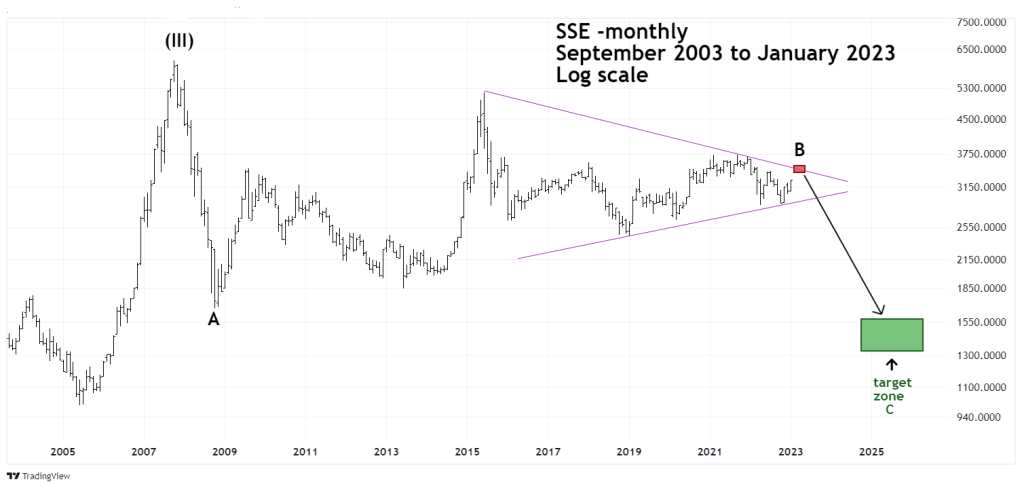
The next bear phase could continue for one or two years reaching at least the area of the October 2008 bottom.
The SSE could be a very important indicator of a potential global stock market top.
