On 01/19/23 the Nasdaq Composite (IXIC) and Russell 2000 exhibited signs of relative bullish strength. More signals emerged on 01/20/23 that the uptrend in U.S stocks has probably resumed.
The daily SPX chart courtesy of Trading View updates the action.
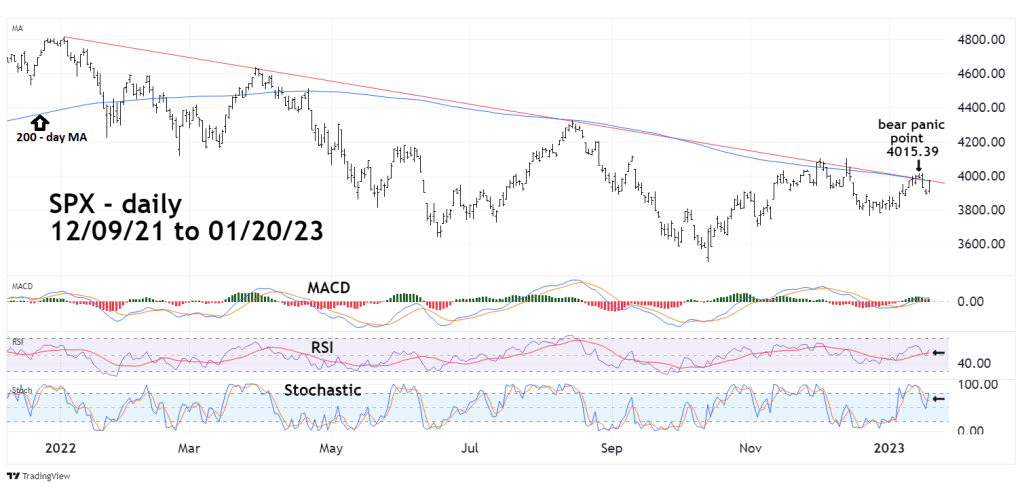
Daily Stochastic has a bullish crossover and RSI has moved above its moving average line. Daily MACD remains bullish.
Additionally, on the recent drop the SPX retraced 51% of its 12/22/22 to 01/17/23 rally. On 01/20/23 the SPX had retraced 67% of its 01/17/23 to 01/19/23 decline. The IXIC had retraced only 41% of its December to January rally. On 01/20/23 it retraced 80% of its 01/18/23 to 01/19/23 drop. Measured by retracements, the bulls are stronger than the bears.
As of 01/20/23 the SPX – 200 – day moving average (MA) and the declining trendline from January 2022 were at the same level. The SPX high and close for the session were marginally above the 200-day MA. It’s possible the recent peak at 4,015.39 could be the new bear panic point. A move over 4,015.39 may trigger short covering and bring in additional long side trades.
The weekly NYSE Advance/Decline chart ($NYAD) courtesy of StockCharts.com updates this indicator.
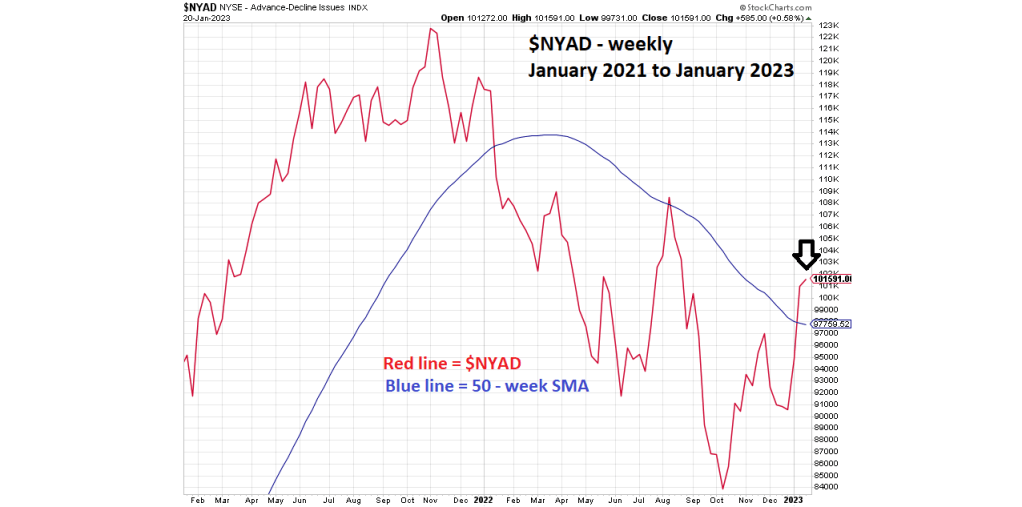
The 01/19/23 blog noted that if $NYAD moved below its 50-week Simple Moving Average (SMA) it could mean an important top was made on 01/17/23. The weekly $NYAD is now moving up.
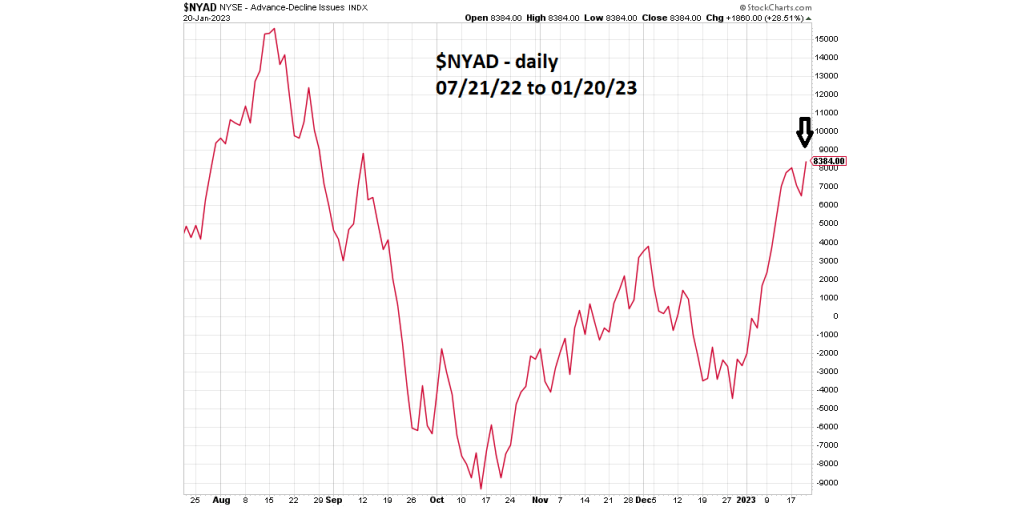
The daily $NYAD chart provides greater detail.
There’s a high probability that a short-term correction ended at the 01/19/23 bottom. A move above SPX 4,015.39 could initiate a strong and steady rally into mid – February 2023.
