On 01/19/23 the S&P 500 (SPX) continued its post 01/17/23 decline with an additional bearish momentum signal implying further downside action.
The daily SPX chart courtesy of Trading View updates three momentum indicators.
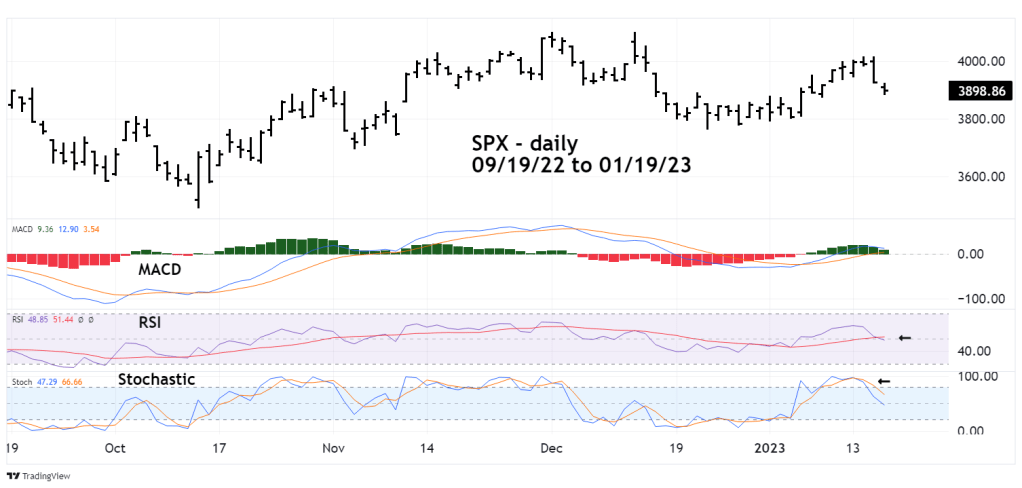
The daily RSI has crossed below its moving average line. Daily Stochastic is far above the oversold zone. MACD has so far no bearish signals.
The 30 minute chart illustrates the action of the Nasdaq Composite (IXIC), Russell 2000 (RUT), and Dow Jones Industrial Average. (DJI).
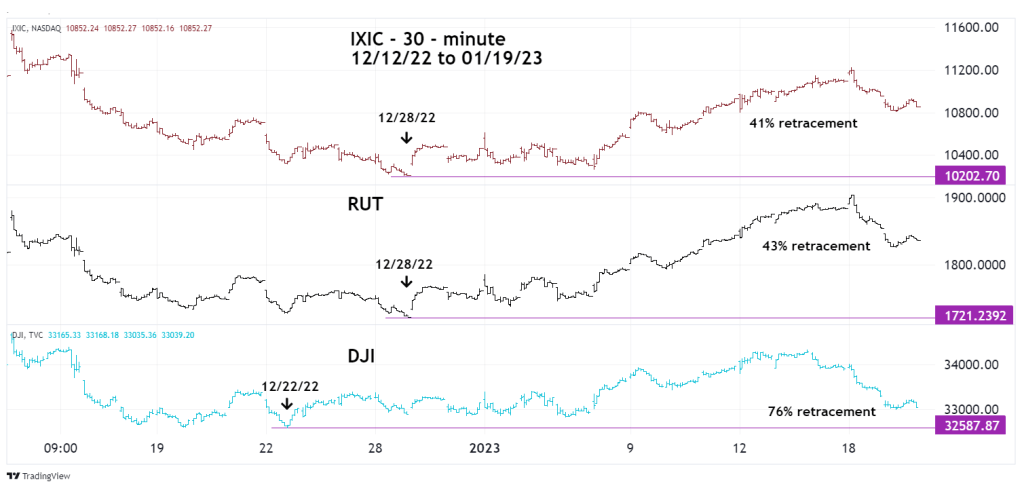
On 01/19/23 the SPX bottomed out just below a 50% retracement of its 12/22/22 to 01/17/23 rally. On 01/19/23 the DJI, which also had a rally after 12/22/22 retraced 76% of that rally.
Both IXIC and Rut had December bottoms after the SPX and DJI. In the current decline IXIC has retraced only 41% of its prior rally, the RUT 43%. It’s curious that IXIC and RUT were relatively weaker than DJI and SPX in December – are now relatively stronger. The RUT is made up of small cap stocks and presumably would be more sensitive to downside action if the U.S economy was nearing a recession.
If the IXIC and RUT continue to be relatively stronger than the SPX and DJI, it could be a sign that the current decline is only a correction within a multi – week rally.
The weekly NYSE Advance/Decline chart ($NYAD) courtesy of StockCharts.com updates this indicator.
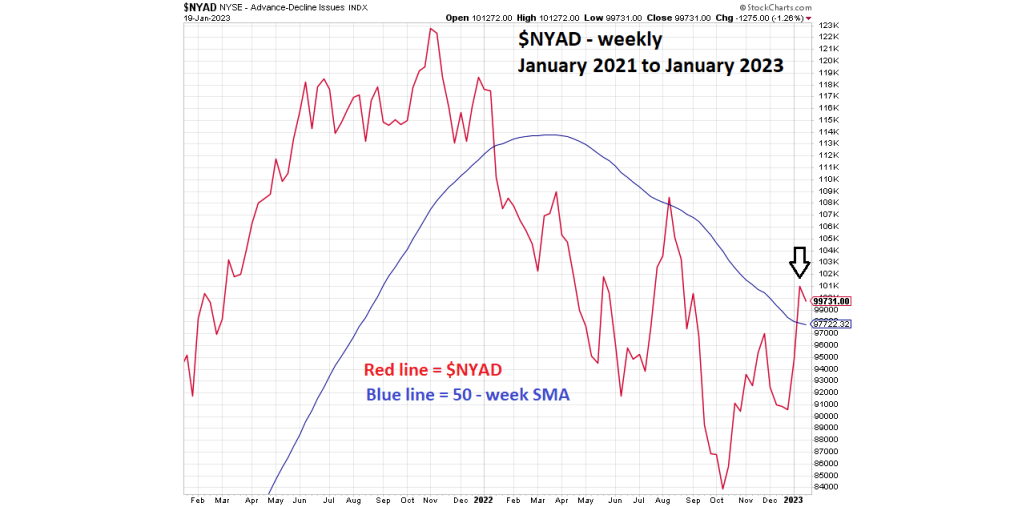
The $NYAD is still above its 50 – week Simple Moving Average (SMA). A move below this line could mean that an important top was made on 01/17/23.
