Since 1/12/23 the bulls have been on the verge of breaking above important resistance near S&P 500 (SPX)– 4,000. Today 01/18/23 The bears held the line and counterattacked with strong selling throughout most of the session. The start of a multi- week bear phase? One indicator could soon give us the answer.
The prior blog “Short-Term Momentum Update 01/13/23” noted that the SPX- 15 -minute MACD – Histogram hinted the rally could continue into the 01/17/23 to 01/20/23 trading week.
On 01/17/23 the SPX made marginal upside progress and reached 4,015.39. On 01/18/23 the SPX attempted to make a new high but failed and peaked at 4,014.16. The drop after this double top was significant and the SPX ended the session down 62.13 points.
The daily SPX chart courtesy of Trading View updates the action.

So far only the SPX daily Stochastic has a bearish lines crossover, RSI has not crossed its moving average line. Daily MACD has not had a bearish line cross and the MACD – Histogram has no bearish divergence. There could be additional bearish momentum signals if the SPX can break below Fibonacci support.
The SPX – 30- minute charts illustrates the near-term Fibonacci support.
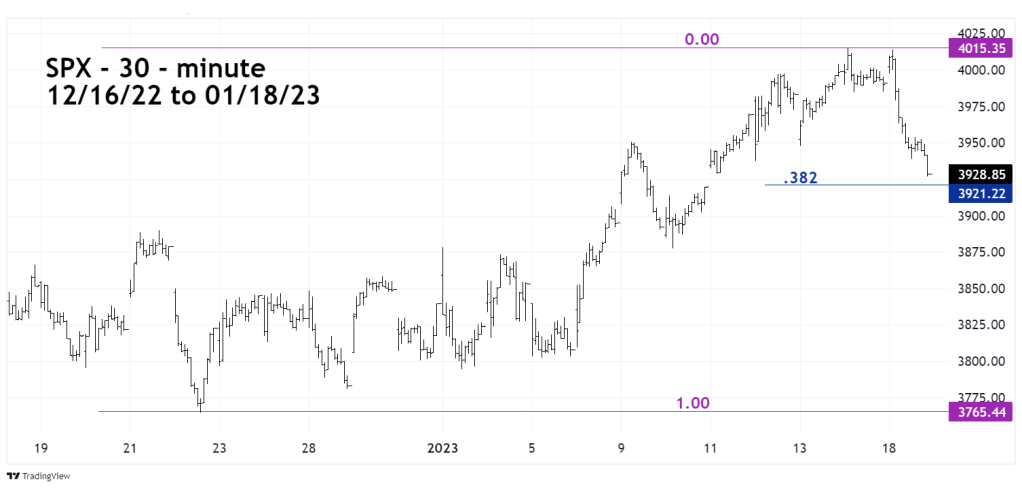
A .382 retracement of the SPX 12/22/22 to 01/17/23 rally is near 3,920. The SPX ended the 01/18/23 session near the low of the day, with intraday momentum oscillators oversold. It’s possible on 01/19/23 there could be at least a short-term bottom near 3,920.
If support near 3,920 is broken, one momentum indicator could become very important in determining the trend.
The weekly NYSE – Advance/Decline line ($NYAD) chart courtesy of StockCharts.com updates this indicator.

The 01/14/23 blog “Rare Bullish Momentum Signal” noted that if $NYAD moved back below its 50 – week simple moving average (SMA) line it could mean a top is in place. A time zone of 01/17/23 to 01/20/23 was given for when the crossover could occur. The rally continued into 01/17/23, also this is a holiday shortened trading week for US stocks. Its more likely a possible a cross below the 50 – week SMA could occur between 01/19/23 to 01/27/23.
If the $NYAD can hold above its 50 – week SMA there’s a good chance U.S stocks could rally into at least mid – February 2023.
