When markets are in a steadily rising trend, bearish momentum divergences will emerge which could later be invalidated. This phenomenon is occurring with the S&P 500 (SPX).
The 15 -minute SPX chart courtesy of Trading View illustrates its short-term trend.
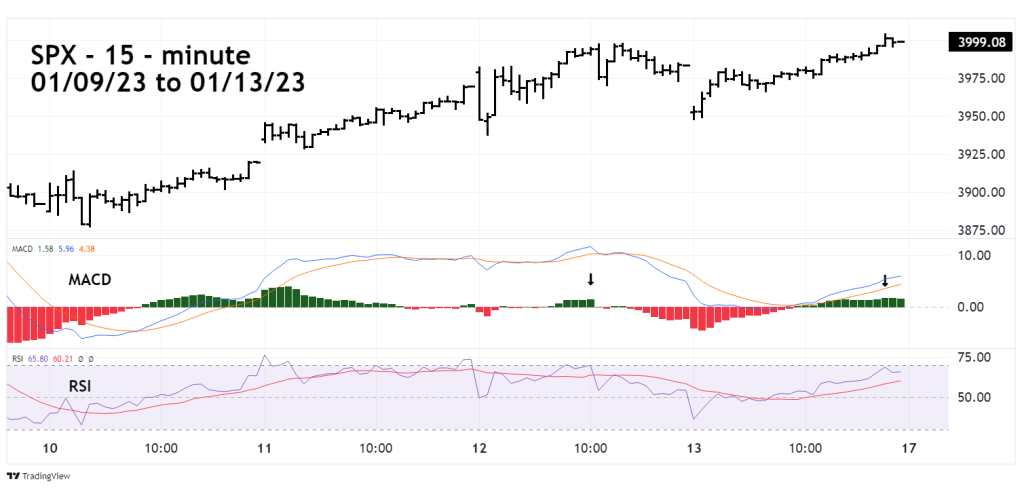
Recent blogs on this website have illustrated that both the SPX – 15 – minute MACD and RSI had bearish divergences.
Note that on 01/13/23 the MACD – Histogram broke above one of its bearish divergences. On 01/12/23 the highest MACD – Histogram reading was 1.43. On 01/13/23 with the SPX at a higher price had a MACD – Histogram reading of 1.80.
On 01/13/23 MACD lines had a bearish divergence and the RSI had a triple bearish divergence.
The MACD – Histogram break of a bearish divergence is the first hint that the SPX could continue to rise in the coming week. This is significant because as of 01/13/23 the SPX closed the session in the area of its 200 – day moving average and the declining trendline from the January 2022 top. If the SPX can decisively move above this level it opens the door for a move up to at least the 4,400 area.
