During the trading week ending 01/13/23 the NYSE – Advance/Decline line ($NYAD) had a bullish reading that’s only occurred four times in times the last fourteen – years. The implications of this signal could mean U.S stocks rally into March/April 2023.
The weekly $NYAD chart courtesy of StockCharts.com illustrates the action since January 2007.

The first time $NYAD crossed above its 50 – week Simple Moving Average (SMA) was in early 2009 just after he start of the secular bull market. The next signal happened in late 2015, the third in early 2016 and the fourth in early 2019.
The shortest bull signal was in 2015 which occurred after only a three-month decline. The bullish signal after this brief drop had a rally of about one – month. The 2019 signal subsequently had a one-year stock rally before a significant decline.
The one – month and one – year signals could be factors in estimating the time length of the recent bullish crossover.
The weekly $NYAD chart shows what’s happened since January 2020.
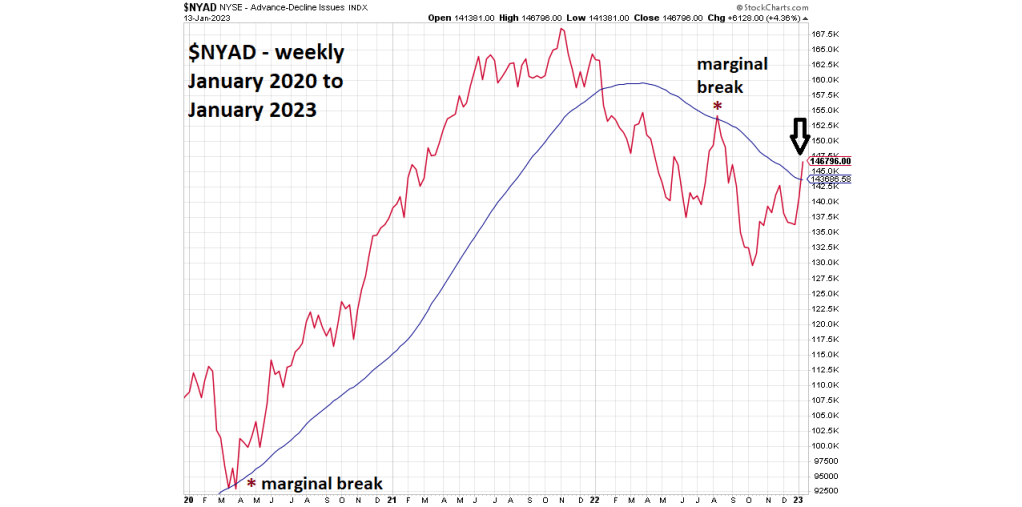
Note that after the 2020 crash $NYAD marginally broke below the 50 – week SMA then moved back above the line. The marginal break signified a bottom. The reverse happened in August 2022 when $NYAD marginally broke above the 50 – week SMA then back below the line.
If during the trading week of 01/17/23 to 01/20/23 $NYAD moves below the 50 – week SMA it could mean a top is in place.
If next week the $NYAD continues to move above the 50 – week SMA, how long could it be before a significant US stock market top forms?
Broader seasonal stock patterns are bullish until late April/early May.
The most bearish factor for the U.S economy and stocks is the inverted yield curve of U.S government debt instruments. On 01/13/23 the rate of 30 – year US Treasury bonds – Trading View symbol (TYX) was 3.62%. On 01/13/23 the rate of 90 – day U.S Treasury bills – Trading View symbol (IRX) was 4.46%.
Inverted yield curves have been very effective in signaling U.S economic recessions several months before they occur. In this case it implies a U.S recession sometime in the second half of 2023. Stocks discount the future, therefore a significant U.S stock market top could happen at least a few months before the recession begins.
The 2015 bullish crossover signaled a one- month rally.
The 2019 bullish crossover signaled a one – year rally.
Perhaps with looming bearish economic fundamentals the current crossover could be signaling a rally between one month and one year? Stocks are seasonally bullish until at least April which fits within the broader one-year time frame.
