Today 0/12/23 the S&P 500 (SPX) broke above Fibonacci resistance in the 3,970 area then reached the bear panic point close to 4,000. While short-term momentum continues to suggest a small decline, longer-term momentum implies a rally that could last for several weeks.
The daily SPX chart courtesy of Trading View updates the action.
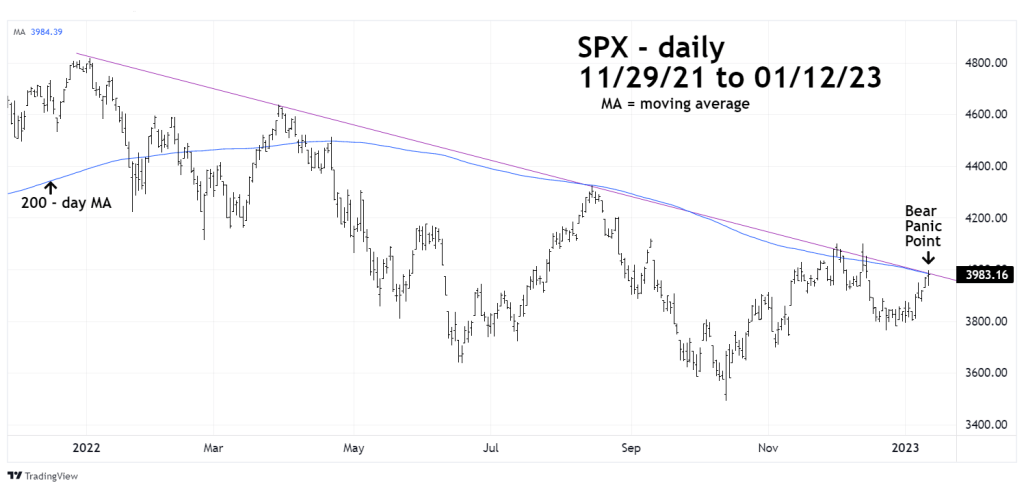
The SPX ended the trading session at 3,983.16, the 200 – day moving average (MA) is at 3,984.39 and almost the same level as the declining trendline from the January 2022 top.
The bears could be trying to push back right at the panic point, however other U.S stock indices had stronger performances than the SPX.
On the session the SPX gained .34%.
The Dow Jones Industrial Average and the Nasdaq Composite both gained .64%.
The Russell 2000 (RUT) – small cap stocks gained 1.74% – five times the SPX gains. It would be unusual if an important top was forming with small cap stocks outperforming the SPX by such a wide margin. Near-term the SPX could have a short – term drop. However, the performance of other U.S stock indices, especially RUT suggest the rally could continue until at least late January or early February.
Another national stock market index is also showing signs its rally could continue.
The weekly UK 100 (UKX) chart illustrates its longer-term picture.
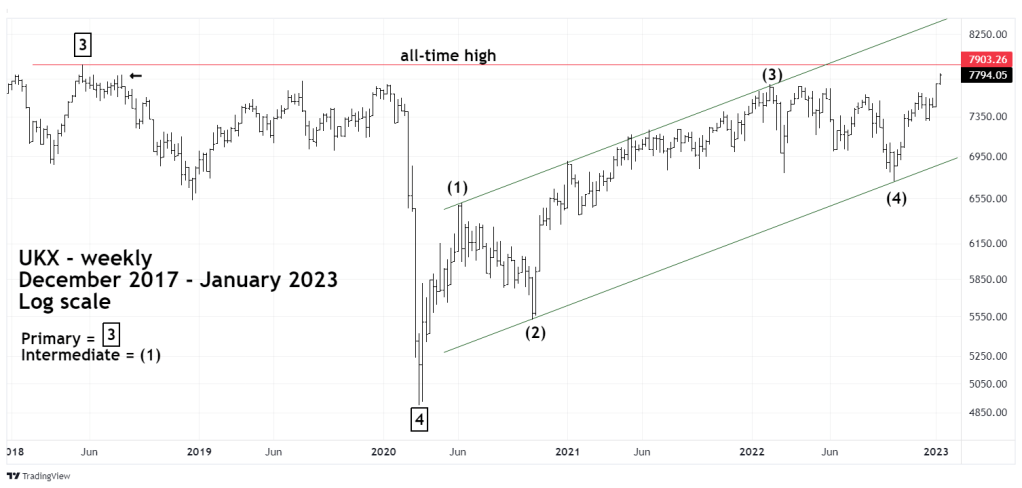
The UKX was the subject of the 01/08/23 blog “UK 100 Upside Breakthrough”. Since then, UKX has had additional upside breakthroughs. It has moved above the peaks made in July 2019 and August 2018 and is now only 1.3% below its all-time high.
If the UKX makes a new all-time high it could aid in the timing of a global stock market top sometime in the first quarter of 2023.
The UKX index is a must watch indicator for traders/investors worldwide!
