Near the end of the 2022 trading year, it appeared the S&P 500 (SPX) was basing for a big move up that could begin on the first trading day of 2023. What happened was a continuation of the sideways move that developed into what looked like an Elliott wave – Horizontal Triangle. On 01/05/23 the SPX broke marginally below the rising trendline from the 12/22/22 bottom. Additionally, the SPX daily RSI broke below its moving average line. With the important U.S employment report due on 01/06/23 it looked as if the SPX was poised for a big move down. The big money traders had other plans.
The daily SPX chart courtesy of Trading View illustrates the action.
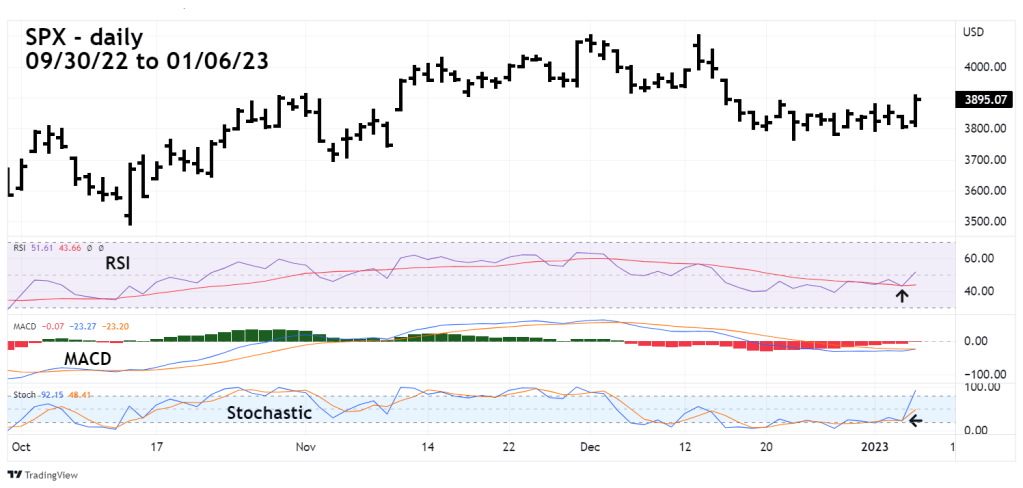
Not only did the SPX move above important resistance at 3,889.82, but there were also two daily bullish momentum signals.
Daily RSI had a bullish cross of its moving average line.
Daily Stochastic had a bullish crossover.
Daily MACD is very close to a bullish signal. At the close of the SPX 01/06/23 session the lower MACD line was -23.27 the upper line -23.20.
There was also a bullish signal on the weekly SPX chart courtesy of BigCharts.com.
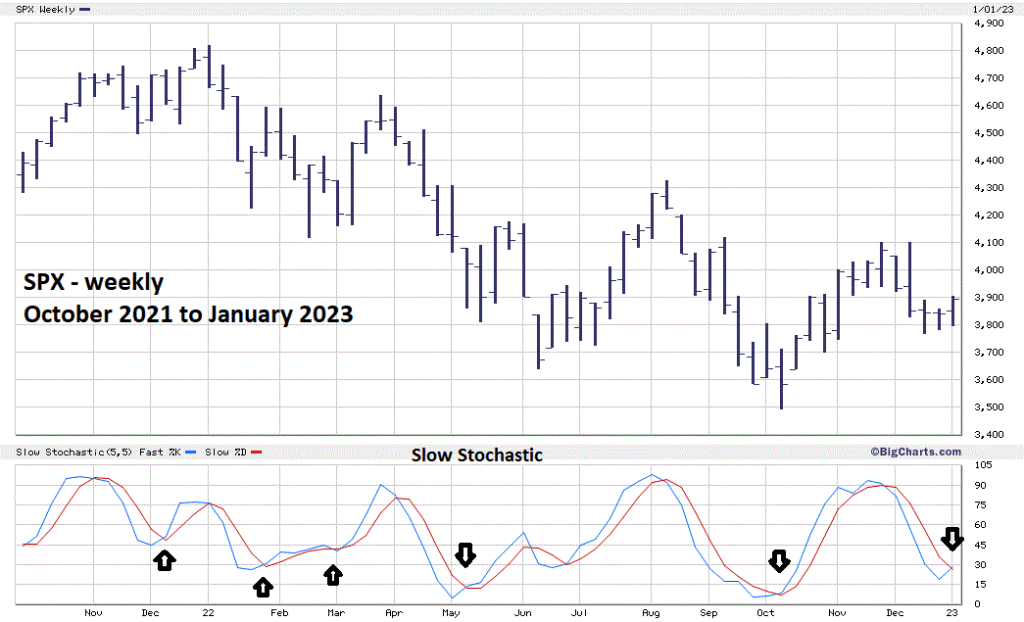
The BigChart.com – Slow Stochastic indicator is one the most effective price oscillators. There’s a bullish crossover for the week ending 01/06/23. Note that the prior five bullish crossovers signaled SPX rallies.
There are always alternate wave counts in Elliott Wave theory. The presume SPX – Horizontal Triangle from 12/20/22 to 01/04/23 was not the correct wave count. Data from the Nasdaq Composite (IXIC) helps to discover what may be the correct SPX – Elliott wave count.
The hourly IXIC chart illustrates its action after its 12/13/22 peak.
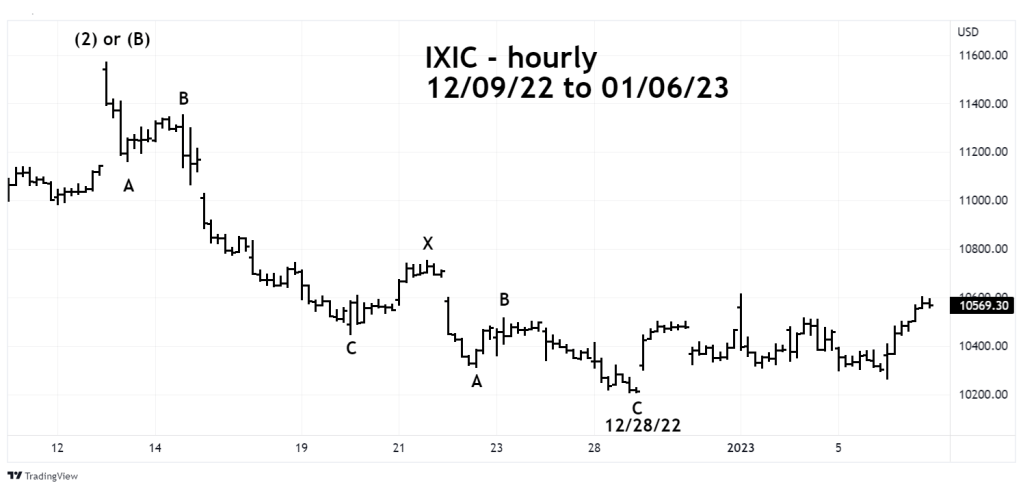
Note that IXIC did not complete its post 12/13/22 decline until 12/28/22. Both the SPX and Dow Jones Industrial Average (DJIA) ended their respective post 12/13/22 declines on 12/22/22. This is what I call a “Rule of the majority” signal. When one of the three main U.S stock indices; SPX, IXIC, and DJIA makes a new high/low unconfirmed by the other two indices, the true trend is with the non-confirming indices. In this situation the true trend is up.
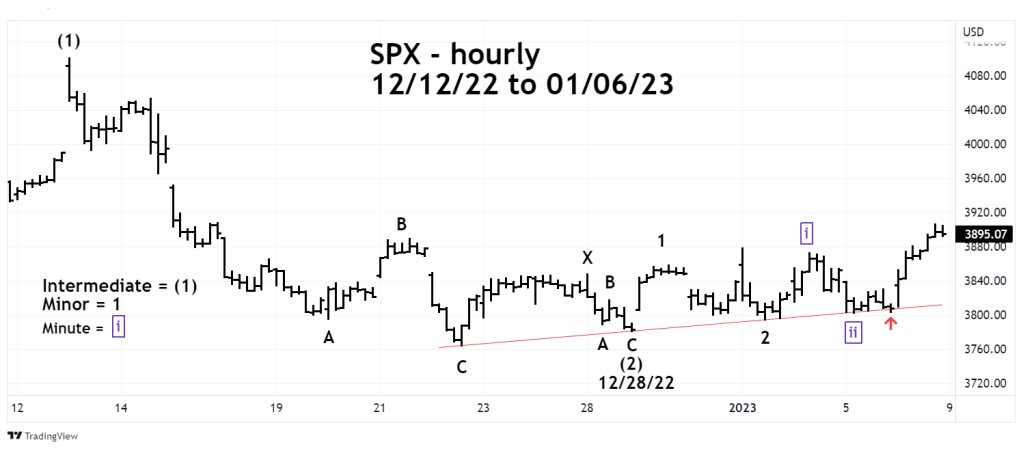
The hourly SPX chart illustrates a revised Elliott wave count.
First an explanation of truncated waves which occur when the fifth wave of a motive pattern fails to exceed the termination point of the third wave. This phenomenon also occurs in corrective patterns where the third part of the correction – wave “C” fails to exceed the termination point of the first part of the correction – wave “A”. In Double Zigzags the second Zigzag fails to exceed the termination point of the first Zigzag.
Truncated waves are the most difficult part of Elliott Wave theory. You can’t predict truncated waves and many times you can’t recognize them until after they have occurred.
The SPX hourly wave count is the same as IXIC except the SPX second Zigzag fails to exceed the low of the first Zigzag.
Note that the choppy rally after the SPX 12/22/22 bottom could still be a corrective pattern of a larger developing down trend.
Elliott wave theory is a subjective methodology, therefore its essential to have momentum and or sentiment evidence to determine the correct wave count. In this situation the evidence from the daily and weekly momentum indicators is bullish. Therefore, the bullish wave count starting at the SPX 12/28/22 bottom has the highest probability of being correct.
In addition to the momentum evidence there’s also bullish sentiment evidence from the recent Put/Call spikes.
January is seasonally a bullish month.
The weight of the evidence is bullish and there’s a good chance the SPX could reach the 4,400 area by late January or early February.
A move below the SPX bottom of 3,803.39 made on 01/05/23 would invalidate the bullish wave count.

Looking at cycles and time we should not break the last swing high (13 dec). If price breaks it: I would say we doing a last ZZ for Y. And imagine parity for Y will be at 4522ES 🤦🏽♂️. Will be funny if we got a expended Y too and ATH. At some point dxy will have to correct. Watching for reactions at 100 or 1.11 eur.
LikeLike
Thanks for the information.
LikeLike