The S&P 500 (SPX) moves up from 12/19/22 to 01/04/23 have been shallow and choppy, the signature of a correction in a down trend. Specifically, the movement appears to be an Elliott wave Horizontal Triangle.
The 30-minute SPX chart courtesy of Trading View shows how this pattern fits within the action since the 10/13/22 bottom.
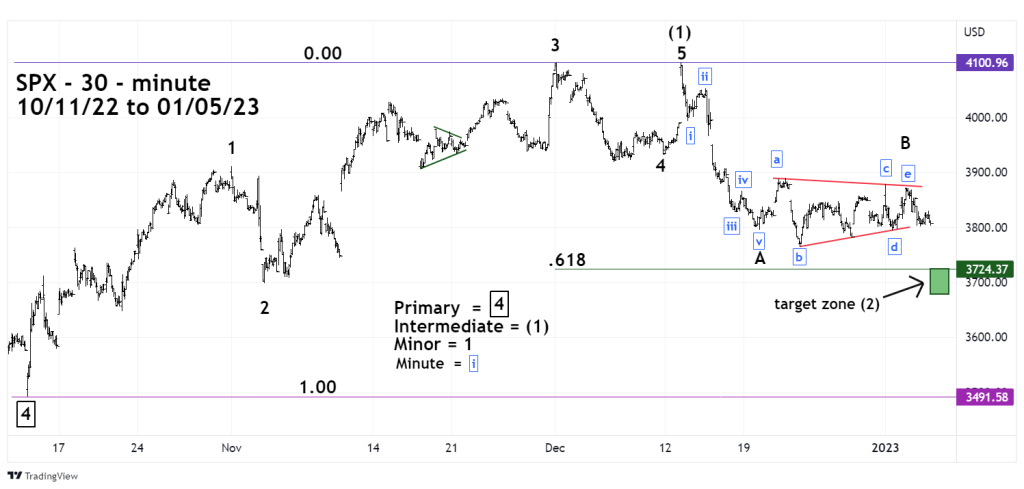
The best count for the move down from 12/13/22 appears to be a developing Elliott wave – Single Zigzag (A-B-C), with a Horizontal Triangle composing Minor wave “B”.
Fibonacci evidence within the sub waves supports this theory.
Minute wave “b” is 1.382 the size of Minute wave “a”.
Minute wave “e” is .618 the size of Minute wave “b”.
Minute wave “d” is close to equal of Minute wave “e”.
If this wave count is correct there could be a sharp move down to and possibly bottom in the 3,725 to 3,680 area.
A bottom could be made in the first hour of trading on 01/06/23. If the SPX continues its drop into the last trading hour of 01/06/23, a more bearish move could be developing.
If the SPX moves above 3,889.82 before breaking below 3,764.49 it would invalidate the presumed Horizontal wave pattern.
