The 12/18/22 blog “Curious Sentiment Spikes” noted some fascinating sentiment signals. What happened today, 12/28/22 with the Put/Call ratio (PC) was extraordinary.
The daily PC and S&P 500 (SPX) chart courtesy of Trading View shows some recent PC signals.
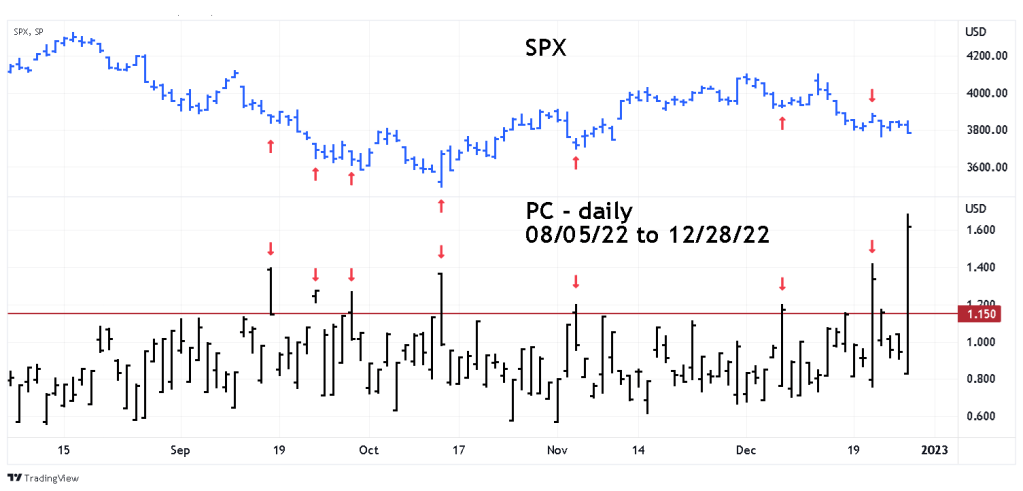
The history of PC signals relative to the SPX since September are as follows.
Investor’s Business Daily uses readings above 1.15 as a signal for potential US stock market bottoms.
09/16/22 – ineffective.
09/23/22 – ineffective.
09/29/22 – just before a short-term SPX bottom.
10/13/22 – Intermediate SPX bottom.
11/03/22 – short – term bottom.
12/07/22 – short – term bottom.
12/21/22 – spike up on a 1.8% SPX rally!
12/28/22 – biggest spike in more than two – years!
How big was the 12/28/22 PC spike? The longer-term SPX/PC daily chart gives perspective.
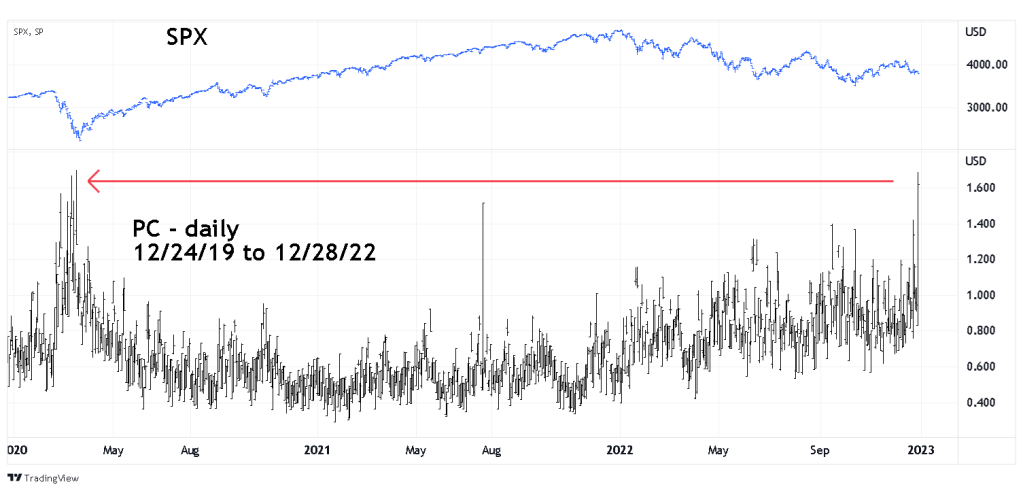
The maximum PC reading on 12/28/22 was 1.686 just below the maximum reading of 1.70 made on 03/18/20, three trading days before the crash bottom on 03/23/20.
The 5- minute SPX chart updates the short-term picture.

The prior blog “Resistance Reached – 12/23/22” noted the SPX reached the area of two Fibonacci coordinates. Today the SPX moved marginally above the 12/23/22 highs but stayed below the maximum leeway point of SPX 3850.
Notice there are seven minor peaks in the 3842 to 3848 area. Just above this zone is the likely area for bears to place stop loss buy orders. A move above 3850 could trigger a short covering panic.
The PC spike up on an SPX 1.8% rally, and huge move up on 12/28/22 came after only a 7% drop from the 12/13/22 peak. The high PC readings so soon after a top imply the bears are very anxious to catch what they think could be sharp decline.
The PC reading of 1.70 in March 2020 came after the SPX declined 25%, and just before a major SPX bottom. It’s unlikely a major SPX bottom is currently forming , however, there soon could be an intermediate bottom. If so, the SPX could rally 15 to 20% into late January 2023.
