Extraordinary high Put/Call reading may have indicated an important bottom.
Today 12/29/22 one trading day after a very high Put/Call ratio, the S&P 500 (SPX) rallied close to 2%.
The hourly SPX chart courtesy of Trading View illustrates a potential base that began on 12/21/22.
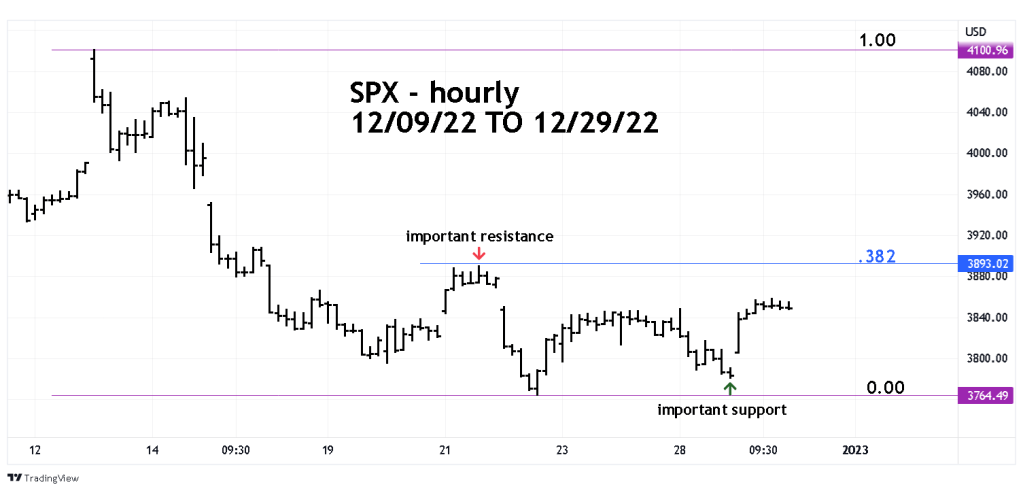
The SPX moved above maximum Fibonacci leeway at 3,850, noted in the 12/28/22 blog. The next important area the bulls need to overcome is chart resistance at 3,889.82. Just above that level is the Fibonacci .382 retracement of the decline from 4,100.96 to 3,764.49. at SPX 3,896.02. The closeness of these two points indicates powerful resistance.
Important support is at the 12/28/22 bottom of 3,764.49, a break below this level could trigger a multi- week decline.
The final trading day of 2022 is 12/30/22, it’s a good guess many traders will take the day off – making for a narrow trading day.
There could be a big move on the first trading day of 2023 – 01/03/23. If the SPX breaks strongly to the upside, it could be the start of an unhappy New Year for the bears.
